ComEd 2013 Annual Report Download - page 60
Download and view the complete annual report
Please find page 60 of the 2013 ComEd annual report below. You can navigate through the pages in the report by either clicking on the pages listed below, or by using the keyword search tool below to find specific information within the annual report.-
 1
1 -
2
-
3
-
4
-
5
-
6
-
7
-
8
-
9
-
10
-
11
-
12
-
13
-
14
-
15
-
16
-
17
-
18
-
19
-
20
-
21
-
22
-
23
-
24
-
25
-
26
-
27
-
28
-
29
-
30
-
31
-
32
-
33
-
34
-
35
-
36
-
37
-
38
-
39
-
40
-
41
-
42
-
43
-
44
-
45
-
46
-
47
-
48
-
49
-
 50
50 -
 51
51 -
 52
52 -
 53
53 -
 54
54 -
 55
55 -
 56
56 -
 57
57 -
 58
58 -
 59
59 -
 60
60 -
 61
61 -
 62
62 -
 63
63 -
 64
64 -
 65
65 -
 66
66 -
 67
67 -
 68
68 -
 69
69 -
 70
70 -
71
-
72
-
73
-
74
-
75
-
76
-
77
-
78
-
79
-
80
-
81
-
82
-
83
-
84
-
85
-
86
-
87
-
88
-
89
-
90
-
91
-
92
-
93
-
94
-
95
-
96
-
97
-
98
-
99
-
100
-
101
-
102
-
103
-
104
-
105
-
106
-
107
-
108
-
109
-
110
-
111
-
112
-
113
-
114
-
115
-
116
-
117
-
118
-
119
-
120
-
121
-
122
-
123
-
124
-
125
-
126
-
127
-
128
-
129
-
130
-
131
-
132
-
133
-
134
-
135
-
136
-
137
-
138
-
139
-
140
-
141
-
142
-
143
-
144
-
145
-
146
-
147
-
148
-
149
-
150
-
151
-
152
-
153
-
154
-
155
-
156
-
157
-
158
-
159
-
160
-
161
-
162
-
163
-
164
-
165
-
166
-
167
-
168
-
169
-
170
-
171
-
172
-
173
-
174
-
175
-
176
-
177
-
178
-
179
-
180
-
181
-
182
-
183
-
184
-
185
-
186
-
187
-
188
-
189
-
190
-
191
-
192
-
193
-
194
-
195
-
196
-
197
-
198
-
199
-
200
-
201
-
202
-
203
-
204
-
205
-
206
-
207
-
208
-
209
-
210
-
211
-
212
-
213
-
214
-
215
-
216
-
217
-
218
-
219
-
220
-
221
-
222
-
223
-
224
-
225
-
226
-
227
-
228
-
229
-
230
-
231
-
232
-
233
-
234
-
235
-
236
-
237
-
238
-
239
-
240
-
241
-
242
-
243
-
244
-
245
-
246
-
247
-
248
-
249
-
250
-
251
-
252
-
253
-
254
-
255
-
256
-
257
-
258
-
259
-
260
 |
 |

TheHealthCare ReformActsinclude a provision that imposesan excisetaxon certainhigh-cost plansbeginningin 2018, whereby
premiums paid over a prescribedthresholdwill betaxedat a 40%rate.Although theexcisetaxdoesnot gointo effect until 2018,
accountingguidancerequiresExelon to incorporate theestimatedimpactoftheexcisetaxinitsannual actuarial valuation.The
application ofthelegislation is still unclear andExelon continuesto monitor theDepartment ofLabor andIRSfor additional
guidance. Effectivein 2002,Constellation amendeditsother postretirement benefit plansfor all subsidiariesother than Nine Mile
Point by cappingretiree medical coveragefor future retireeswhowere under theageof55on January1,2002 at 2002 levels.
Therefore,theexcisetaxisnot expectedto haveamaterial impactonthelegacy Constellation other postretirement benefit plans.
However,certainkeyassumptionsare requiredto estimate theimpactoftheexcisetaxon theother postretirement obligation for
legacy Exelon plans, includingprojectedinflation rates(basedon theCPI) andwhether pre-andpost-65 retiree populationscan be
aggregatedindeterminingthe premiumvaluesofhealthcare benefits. Exelon reflecteditsbestestimate oftheexpectedimpactinits
annual actuarial valuation.
Health Care Cost Trend Rate. Assumedhealthcare cost trendrateshaveasignificant effectonthecostsreportedfor Exelon’s
other postretirement benefit plans. Accountingguidancerequiresthat annual healthcare costestimatesbedevelopedusingpast
andpresent healthcare cost trends (bothfor Exelon andacross thebroader economy), aswell asexpectationsofhealthcare cost
escalation,changesinhealthcare utilization anddeliverypatterns, technological advancesandchangesinthehealthstatusofplan
participants. Therefore,the trendrate assumption is subjecttosignificant uncertainty, particularlywhen consideringpotential impacts
ofthe 2010 HealthCare ReformActs. Exelon assumedan initial healthcare cost trendrate of 6.50%for 2013,decreasingto an
ultimate healthcare cost trendrate of5.00%in 2017.
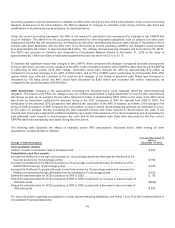
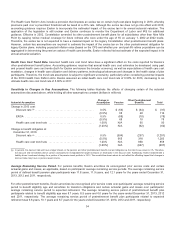
Sensitivity to Changes in Key Assumptions. Thefollowingtablesillustrate theeffectsofchangingcertainoftheactuarial
assumptions discussedabove, while holdingall other assumptionsconstant (dollarsinmillions):
Actuarial Assumption
Change in
Assumption Pension
Other Postretirement
Benefits Total
Changein 2013 cost:
Discount rate (a)........................................... 0.5% $ (63)$(34) $ (97)
(0.5%) 68 48 116
EROA.................................................. 0.5% (68) (10) (78)
(0.5%) 68 10 78
Healthcare cost trendrate ................................. 1.00%N/A9090
(1.00%) N/A(62)(62)
Changeinbenefitobligation at
December 31,2013:
Discount rate (a)........................................... 0.5% (904) (297) (1,201)
(0.5%) 965 3181,283
Healthcare cost trendrate ................................. 1.00%N/A858 858
(1.00%) N/A(607) (607)
(a)Ingeneral,thediscount rate will have a larger impactonthe pension andother postretirement benefitcostandobligation asthe rate movescloser to 0%. Therefore,
thediscount rate sensitivitiesabovecannot necessarilybeextrapolatedfor larger increasesor decreasesinthediscount rate.Additionally, Exelon implementeda
liability-driven investment strategy for a portion ofitspension asset portfolioin 2010.Thesensitivitiesshownabovedo not reflecttheoffsettingimpactthat changesin
discount ratesmayhave on pension asset returns.
Average Remaining Service Period. For pension benefits, Exelon amortizesitsunrecognizedprior servicecostsandcertain
actuarial gainsandlosses, asapplicable,basedon participants’ averageremainingservice periods. Theaverageremainingservice
periodofdefinedbenefit pension plan participantswas11.8 years, 11.9 years, and12.1yearsfor theyearsendedDecember 31,
2013,2012 and2011,respectively.
For other postretirement benefits, Exelon amortizesitsunrecognizedprior servicecostsover participants’ averageremainingservice
periodto benefiteligibilityageandamortizesitstransition obligationsandcertainactuarial gainsandlossesover participants’
averageremainingservice periodto expectedretirement.Theaverageremainingservice periodofpostretirement benefit plan
participantsrelatedto benefiteligibilityagewas 8.7 years, 8.9 yearsand 6.6 yearsfor theyearsendedDecember 31,2013,2012
and2011,respectively. Theaverageremainingservice periodofpostretirement benefit plan participantsrelatedto expected
retirement was 9.8 years, 10.1yearsand 8.7 yearsfor theyearsendedDecember 31,2013,2012 and2011,respectively.
54