ComEd 2013 Annual Report Download - page 187
Download and view the complete annual report
Please find page 187 of the 2013 ComEd annual report below. You can navigate through the pages in the report by either clicking on the pages listed below, or by using the keyword search tool below to find specific information within the annual report.-
 1
1 -
2
-
3
-
4
-
5
-
6
-
7
-
8
-
9
-
10
-
11
-
12
-
13
-
14
-
15
-
16
-
17
-
18
-
19
-
20
-
21
-
22
-
23
-
24
-
25
-
26
-
27
-
28
-
29
-
30
-
31
-
32
-
33
-
34
-
35
-
36
-
37
-
38
-
39
-
40
-
41
-
42
-
43
-
44
-
45
-
46
-
47
-
48
-
49
-
50
-
51
-
52
-
53
-
54
-
55
-
56
-
57
-
58
-
59
-
60
-
61
-
62
-
63
-
64
-
65
-
66
-
67
-
68
-
69
-
70
-
71
-
72
-
73
-
74
-
75
-
76
-
77
-
78
-
79
-
80
-
81
-
82
-
83
-
84
-
85
-
86
-
87
-
88
-
89
-
90
-
91
-
92
-
93
-
94
-
95
-
96
-
97
-
98
-
99
-
100
-
101
-
102
-
103
-
104
-
105
-
106
-
107
-
108
-
109
-
110
-
111
-
112
-
113
-
114
-
115
-
116
-
117
-
118
-
119
-
120
-
121
-
122
-
123
-
124
-
125
-
126
-
127
-
128
-
129
-
130
-
131
-
132
-
133
-
134
-
135
-
136
-
137
-
138
-
139
-
140
-
141
-
142
-
143
-
144
-
145
-
146
-
147
-
148
-
149
-
150
-
151
-
152
-
153
-
154
-
155
-
156
-
157
-
158
-
159
-
160
-
161
-
162
-
163
-
164
-
165
-
166
-
167
-
168
-
169
-
170
-
171
-
172
-
173
-
174
-
175
-
176
-
 177
177 -
 178
178 -
 179
179 -
 180
180 -
 181
181 -
 182
182 -
 183
183 -
 184
184 -
 185
185 -
 186
186 -
 187
187 -
 188
188 -
 189
189 -
 190
190 -
 191
191 -
 192
192 -
 193
193 -
 194
194 -
 195
195 -
 196
196 -
 197
197 -
198
-
199
-
200
-
201
-
202
-
203
-
204
-
205
-
206
-
207
-
208
-
209
-
210
-
211
-
212
-
213
-
214
-
215
-
216
-
217
-
218
-
219
-
220
-
221
-
222
-
223
-
224
-
225
-
226
-
227
-
228
-
229
-
230
-
231
-
232
-
233
-
234
-
235
-
236
-
237
-
238
-
239
-
240
-
241
-
242
-
243
-
244
-
245
-
246
-
247
-
248
-
249
-
250
-
251
-
252
-
253
-
254
-
255
-
256
-
257
-
258
-
259
-
260
 |
 |

Generation
Intercompany
Eliminations Exelon
Year Ended December 31, 2013
Operating
Revenues
Purchased
Power
and Fuel Total
Operating
Revenues (a) Total
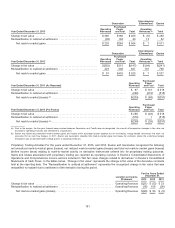
Changeinfairvalue ............................................. $285 $180$ 465 $ (6) $ 459
Reclassification to realizedat settlement ............................ (65) 1043913 52
Net mark-to-market gains ..................................... $220 $284 $ 504$7 $511
Generation
Intercompany
Eliminations Exelon
Year Ended December 31, 2012
Operating
Revenues
Purchased
Power
and Fuel Total
Operating
Revenues (a) Total
Changeinfairvalue ............................................. $(362)$215$(147) $ (94) $(241)
Reclassification to realizedat settlement ............................ 429238 667 101 768
Net mark-to-market gains ..................................... $ 67 $453$520 $7 $527
Year Ended December 31, 2011 (As Reported)
Operating
Revenues
Purchased
Power
and Fuel Total
Changeinfairvalue .................................................................. $ 87 $131 $218
Reclassification to realizedat settlement ................................................. (296) (219) (515)
Net mark-to-market (losses) (b) ...................................................... $(209) $ (88) $(297)
Year Ended December 31, 2011 (Pro Forma)
Operating
Revenues
Purchased
Power
and Fuel Total
Changeinfairvalue .................................................................. $258 $ (40)$218
Reclassification to realizedat settlement ................................................. (516) 1(515)
Net mark-to-market (losses) (b) ...................................................... $(258) $ (39) $(297)
(a)Prior to themerger,thefive-year financial swap contractbetween Generation andComEd wasde-designated. Asaresult,all prospectivechangesinfairvalue are
recordedto operatingrevenuesandeliminatedinconsolidation.
(b) Exelon has historicallypresentedmark-to-market gainsandlosseswithin purchasedpower expensefor all non-trading, energy-relatedderivativesthat were not
accountedfor ascash flowhedges. In 2011,Exelon andGeneration classifiedthemark-to-market gainsandlossesfor contracts, where theunderlyinghedged
transaction wasan expectedsale to hedgepower,to operatingrevenues.
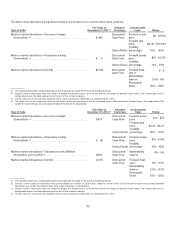
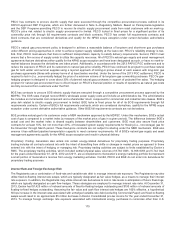
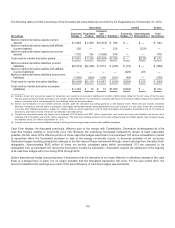
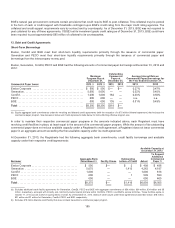
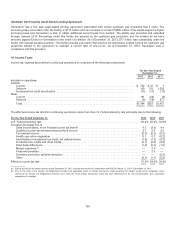
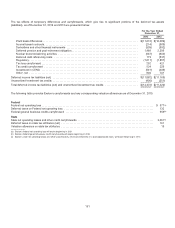
Proprietary Trading Activities For theyearsendedDecember 31,2013,and2012,Exelon andGeneration recognizedthefollowing
net unrealizedmark-to-market gains(losses), net realizedmark-to-market gains(losses) andtotal net mark-to-market gains(losses)
(before incometaxes) relatingto mark-to-market activityon derivativeinstrumentsenteredinto for proprietarytradingpurposes.
Gainsandlossesassociatedwithproprietarytradingare reportedasoperatingrevenue inExelon’s ConsolidatedStatementsof
OperationsandComprehensiveIncomeandare includedin“Net fairvalue changesrelatedto derivatives” inExelon’s Consolidated
StatementsofCash Flows. Inthetablesbelow, “Changeinfairvalue”representsthechangeinfairvalue ofthederivativecontracts
heldat the reportingdate.The“Reclassification to realizedat settlement”representstherecognizedchangeinfairvalue that was
reclassifiedto realizeddue to settlement ofthederivativeduringthe period.
Location on Income
Statement
For the Years Ended
December 31,
2013 2012 2011
Changeinfairvalue ........................................................ OperatingRevenue $(21)$(12)$23
Reclassification to realizedat settlement ....................................... OperatingRevenue (18) 108(26)
Net mark-to-market gains(losses) ......................................... OperatingRevenue $(39) $ 96 $ (3)
181