ComEd 2013 Annual Report Download - page 84
Download and view the complete annual report
Please find page 84 of the 2013 ComEd annual report below. You can navigate through the pages in the report by either clicking on the pages listed below, or by using the keyword search tool below to find specific information within the annual report.-
 1
1 -
2
-
3
-
4
-
5
-
6
-
7
-
8
-
9
-
10
-
11
-
12
-
13
-
14
-
15
-
16
-
17
-
18
-
19
-
20
-
21
-
22
-
23
-
24
-
25
-
26
-
27
-
28
-
29
-
30
-
31
-
32
-
33
-
34
-
35
-
36
-
37
-
38
-
39
-
40
-
41
-
42
-
43
-
44
-
45
-
46
-
47
-
48
-
49
-
50
-
51
-
52
-
53
-
54
-
55
-
56
-
57
-
58
-
59
-
60
-
61
-
62
-
63
-
64
-
65
-
66
-
67
-
68
-
69
-
70
-
71
-
72
-
73
-
 74
74 -
 75
75 -
 76
76 -
 77
77 -
 78
78 -
 79
79 -
 80
80 -
 81
81 -
 82
82 -
 83
83 -
 84
84 -
 85
85 -
 86
86 -
 87
87 -
 88
88 -
 89
89 -
 90
90 -
 91
91 -
 92
92 -
 93
93 -
 94
94 -
95
-
96
-
97
-
98
-
99
-
100
-
101
-
102
-
103
-
104
-
105
-
106
-
107
-
108
-
109
-
110
-
111
-
112
-
113
-
114
-
115
-
116
-
117
-
118
-
119
-
120
-
121
-
122
-
123
-
124
-
125
-
126
-
127
-
128
-
129
-
130
-
131
-
132
-
133
-
134
-
135
-
136
-
137
-
138
-
139
-
140
-
141
-
142
-
143
-
144
-
145
-
146
-
147
-
148
-
149
-
150
-
151
-
152
-
153
-
154
-
155
-
156
-
157
-
158
-
159
-
160
-
161
-
162
-
163
-
164
-
165
-
166
-
167
-
168
-
169
-
170
-
171
-
172
-
173
-
174
-
175
-
176
-
177
-
178
-
179
-
180
-
181
-
182
-
183
-
184
-
185
-
186
-
187
-
188
-
189
-
190
-
191
-
192
-
193
-
194
-
195
-
196
-
197
-
198
-
199
-
200
-
201
-
202
-
203
-
204
-
205
-
206
-
207
-
208
-
209
-
210
-
211
-
212
-
213
-
214
-
215
-
216
-
217
-
218
-
219
-
220
-
221
-
222
-
223
-
224
-
225
-
226
-
227
-
228
-
229
-
230
-
231
-
232
-
233
-
234
-
235
-
236
-
237
-
238
-
239
-
240
-
241
-
242
-
243
-
244
-
245
-
246
-
247
-
248
-
249
-
250
-
251
-
252
-
253
-
254
-
255
-
256
-
257
-
258
-
259
-
260
 |
 |

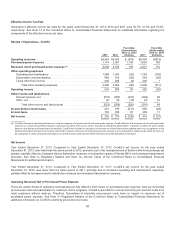
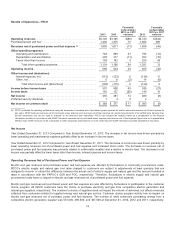
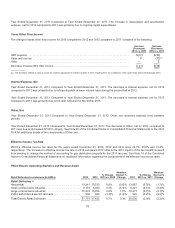
Year Ended December 31, 2012 Compared to Year Ended December 31, 2011. Theincreaseindepreciation andamortization
expense,net for 2012 comparedto 2011 wasprimarilydue to ongoingcapital expenditures.
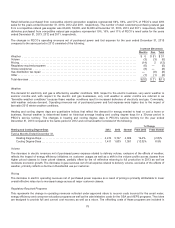
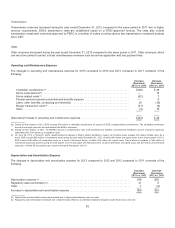
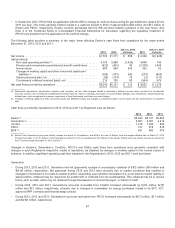
Taxes Other Than Income
Thechangeintaxesother than incomefor 2013 comparedto 2012 and2012 comparedto 2011 consistedofthefollowing:
Increase
(Decrease)
2013 vs. 2012
Increase
(Decrease)
2012 vs. 2011
GRTexpense......................................................................... $(12)$(33)
Salesandusetax ...................................................................... 8 (12)(a)
Other ................................................................................ — 2
Decreaseintaxesother than income...................................................... $ (4) $(43)
(a)Thedecreasereflectsasalesandusetaxreserveadjustment inthefirstquarter of2012 resultingfromthecompletion oftheauditoftaxyears2005through 2010.
Interest Expense, Net
Year Ended December 31, 2013 Compared to Year Ended December 31, 2012. Thedecreaseininterestexpense,net for 2013
comparedto 2012 wasprimarilydue to refinancingdebtatlower interest ratesduringthesecondhalfof2012.
Year Ended December 31, 2012 Compared to Year Ended December 31, 2011. Thedecreaseininterestexpense,net for 2012
comparedto 2011 wasprimarilydue to thedebt retirement inNovember 2011.
Other, Net
Year Ended December 31, 2013 Compared to Year Ended December 31, 2012. Other,net remainedrelativelylevel between
periods.
Year Ended December 31, 2012 Compared to Year Ended December 31, 2011. ThedecreaseinOther,net for 2012 comparedto
2011 wasdue to decreasedAFUDC—Equity. See Note 20 oftheCombinedNotesto ConsolidatedFinancial Statementsinthe 2012
10-K for additional detailsofthecomponentsofOther,net.
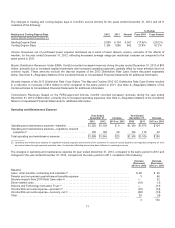
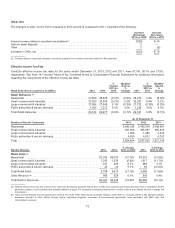
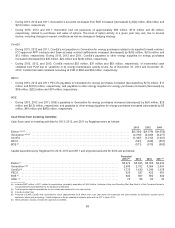
Effective Income Tax Rate
PECO’s effectiveincometaxratesfor theyearsendedDecember 31,2013,2012 and2011 were 29.1%, 25.0%and27.3%,
respectively. Theincreaseineffectiveincometaxrate in 2013 compared2012 reflectsthe 2012 impactofthetaxbenefitreceived
fromelectingto changethemethodofaccountingfor gas distribution propertyfor the 2011 taxyear.See Note 14oftheCombined
Notesto ConsolidatedFinancial Statementsfor additional information regardingthecomponentsoftheeffectiveincometaxrates.
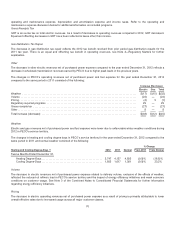
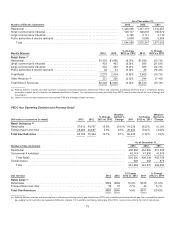
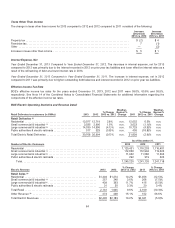
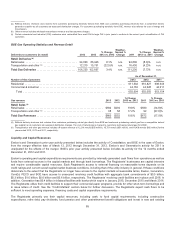
PECO Electric Operating Statistics and Revenue Detail
Retail Deliveries to customers (in GWhs) 2013 2012
% Change
2013 vs. 2012
Weather-
Normal %
Change 2011
% Change
2012 vs. 2011
Weather-
Normal %
Change
Retail Deliveries (a)
Residential ........................................ 13,34113,233 0.8% (0.0)% 13,687 (3.3)% (1.7)%
Small commercial &industrial ......................... 8,101 8,0630.5% (1.1)% 8,321 (3.1)% (2.3)%
Largecommercial &industrial ......................... 15,379 15,2530.8% 1.5% 15,677 (2.7)% (2.7)%
Public authorities&electric railroads ................... 930 943(1.4)% (1.4)% 945 (0.2)% (0.2)%
Total Electric RetailDeliveries......................... 37,75137,4920.7% 0.3%38,630 (2.9)% (2.2)%
78