ComEd 2013 Annual Report Download - page 74
Download and view the complete annual report
Please find page 74 of the 2013 ComEd annual report below. You can navigate through the pages in the report by either clicking on the pages listed below, or by using the keyword search tool below to find specific information within the annual report.-
 1
1 -
2
-
3
-
4
-
5
-
6
-
7
-
8
-
9
-
10
-
11
-
12
-
13
-
14
-
15
-
16
-
17
-
18
-
19
-
20
-
21
-
22
-
23
-
24
-
25
-
26
-
27
-
28
-
29
-
30
-
31
-
32
-
33
-
34
-
35
-
36
-
37
-
38
-
39
-
40
-
41
-
42
-
43
-
44
-
45
-
46
-
47
-
48
-
49
-
50
-
51
-
52
-
53
-
54
-
55
-
56
-
57
-
58
-
59
-
60
-
61
-
62
-
63
-
 64
64 -
 65
65 -
 66
66 -
 67
67 -
 68
68 -
 69
69 -
 70
70 -
 71
71 -
 72
72 -
 73
73 -
 74
74 -
 75
75 -
 76
76 -
 77
77 -
 78
78 -
 79
79 -
 80
80 -
 81
81 -
 82
82 -
 83
83 -
 84
84 -
85
-
86
-
87
-
88
-
89
-
90
-
91
-
92
-
93
-
94
-
95
-
96
-
97
-
98
-
99
-
100
-
101
-
102
-
103
-
104
-
105
-
106
-
107
-
108
-
109
-
110
-
111
-
112
-
113
-
114
-
115
-
116
-
117
-
118
-
119
-
120
-
121
-
122
-
123
-
124
-
125
-
126
-
127
-
128
-
129
-
130
-
131
-
132
-
133
-
134
-
135
-
136
-
137
-
138
-
139
-
140
-
141
-
142
-
143
-
144
-
145
-
146
-
147
-
148
-
149
-
150
-
151
-
152
-
153
-
154
-
155
-
156
-
157
-
158
-
159
-
160
-
161
-
162
-
163
-
164
-
165
-
166
-
167
-
168
-
169
-
170
-
171
-
172
-
173
-
174
-
175
-
176
-
177
-
178
-
179
-
180
-
181
-
182
-
183
-
184
-
185
-
186
-
187
-
188
-
189
-
190
-
191
-
192
-
193
-
194
-
195
-
196
-
197
-
198
-
199
-
200
-
201
-
202
-
203
-
204
-
205
-
206
-
207
-
208
-
209
-
210
-
211
-
212
-
213
-
214
-
215
-
216
-
217
-
218
-
219
-
220
-
221
-
222
-
223
-
224
-
225
-
226
-
227
-
228
-
229
-
230
-
231
-
232
-
233
-
234
-
235
-
236
-
237
-
238
-
239
-
240
-
241
-
242
-
243
-
244
-
245
-
246
-
247
-
248
-
249
-
250
-
251
-
252
-
253
-
254
-
255
-
256
-
257
-
258
-
259
-
260
 |
 |

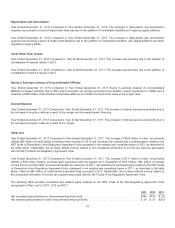
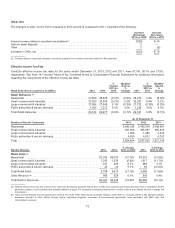
Effective Income Tax Rate.
Generation’s effectiveincometaxratesfor theyearsendedDecember 31,2013,2012 and2011 were 36.7%, 47.3%and37.4%,
respectively. See Note 14oftheCombinedNotesto ConsolidatedFinancial Statementsfor additional information regardingthe
componentsoftheeffectiveincometaxrates.
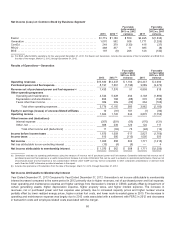
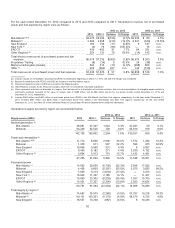
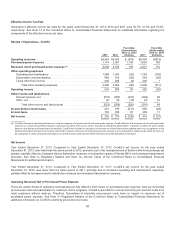
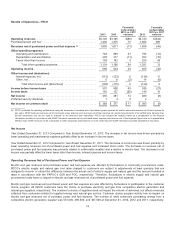
Results of Operations—ComEd
2013 2012
Favorable
(Unfavorable)
2013 vs. 2012
Variance 2011
Favorable
(Unfavorable)
2012 vs. 2011
Variance
Operating revenues ............................................. $4,464 $5,443$ (979) $6,056 $(613)
Purchased power expense ....................................... 1,174 2,3071,133 3,035728
Revenues net of purchased power expense (a) ...................... 3,2903,136154 3,021 115
Other operating expenses
Operatingandmaintenance.................................... 1,368 1,345 (23)1,189 (156)
Depreciation andamortization .................................. 669 610 (59) 554 (56)
Taxesother than income....................................... 299 295 (4) 296 1
Total other operatingexpenses ............................. 2,3362,250(86) 2,039(211)
Operating income ............................................... 954 886 68 982(96)
Other income and (deductions)
Interestexpense,net .......................................... (579) (307) (272)(345) 38
Other,net ................................................... 2639(13)2910
Total other incomeand(deductions) ......................... (553)(268) (285) (316) 48
Income before income taxes ...................................... 401 618(217) 666 (48)
Income taxes ................................................... 1522398725011
Net income ..................................................... $ 249 $ 379 $ (130)$416$(37)
(a)ComEd evaluatesitsoperatingperformanceusingthemeasure ofrevenuesnet ofpurchasedpower expense.ComEd believesthat revenuesnet ofpurchasedpower
expenseis auseful measurement becauseit providesinformation that can beusedto evaluate itsoperational performance.Ingeneral,ComEd onlyearnsmargin
basedon thedeliveryandtransmission ofelectricity. ComEd hasincludedits discussion ofrevenuesnet ofpurchasedpower expensebelowasacomplement to the
financial information providedinaccordancewithGAAP. However,revenuesnet ofpurchasedpower expenseis not a presentation definedunder GAAPandmaynot
becomparable to other companies’ presentationsor deemedmore useful than theGAAPinformation providedelsewhere inthis report.
Net Income
Year Ended December 31, 2013, Compared to Year Ended December 31, 2012. ComEd’s net incomefor theyear ended
December 31,2013,waslower than thesame periodin 2012,primarilydue to theremeasurement ofExelon’s like-kindexchangetax
position,partiallyoffset by increasedelectric distribution revenues, includingtheimpactsofSenate Bill 9, andincreasedtransmission
revenues. See Note 3—RegulatoryMattersandNote 14—IncomeTaxesoftheCombinedNotesto ConsolidatedFinancial
Statementsfor additional information.
Year Ended December 31, 2012, Compared to Year Ended December 31, 2011. ComEd’s net incomefor theyear ended
December 31,2012,waslower than thesame periodin 2011,primarilydue to increasedoperatingandmaintenanceexpenses,
partiallyoffset by increasedelectric distribution revenuesandincreasedtransmission revenues.
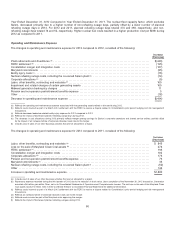
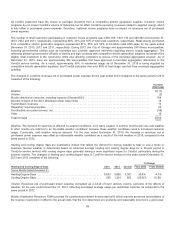
Operating Revenues Net of Purchased Power Expense
There are certaindriversofoperatingrevenuesthat are fullyoffset by theirimpact on purchasedpower expense,such ascommodity
procurement costsandparticipation incustomer choice programs. ComEd is permittedto recover electricityprocurement costsfrom
retailcustomerswithout mark-up.Therefore,fluctuationsin electricityprocurement costshavenoimpactonrevenuesnet of
purchasedpower expense.See Note 3—RegulatoryMattersoftheCombinedNotesto ConsolidatedFinancial Statementsfor
additional information on ComEd’s electricityprocurement process.
68