ComEd 2013 Annual Report Download - page 210
Download and view the complete annual report
Please find page 210 of the 2013 ComEd annual report below. You can navigate through the pages in the report by either clicking on the pages listed below, or by using the keyword search tool below to find specific information within the annual report.-
 1
1 -
2
-
3
-
4
-
5
-
6
-
7
-
8
-
9
-
10
-
11
-
12
-
13
-
14
-
15
-
16
-
17
-
18
-
19
-
20
-
21
-
22
-
23
-
24
-
25
-
26
-
27
-
28
-
29
-
30
-
31
-
32
-
33
-
34
-
35
-
36
-
37
-
38
-
39
-
40
-
41
-
42
-
43
-
44
-
45
-
46
-
47
-
48
-
49
-
50
-
51
-
52
-
53
-
54
-
55
-
56
-
57
-
58
-
59
-
60
-
61
-
62
-
63
-
64
-
65
-
66
-
67
-
68
-
69
-
70
-
71
-
72
-
73
-
74
-
75
-
76
-
77
-
78
-
79
-
80
-
81
-
82
-
83
-
84
-
85
-
86
-
87
-
88
-
89
-
90
-
91
-
92
-
93
-
94
-
95
-
96
-
97
-
98
-
99
-
100
-
101
-
102
-
103
-
104
-
105
-
106
-
107
-
108
-
109
-
110
-
111
-
112
-
113
-
114
-
115
-
116
-
117
-
118
-
119
-
120
-
121
-
122
-
123
-
124
-
125
-
126
-
127
-
128
-
129
-
130
-
131
-
132
-
133
-
134
-
135
-
136
-
137
-
138
-
139
-
140
-
141
-
142
-
143
-
144
-
145
-
146
-
147
-
148
-
149
-
150
-
151
-
152
-
153
-
154
-
155
-
156
-
157
-
158
-
159
-
160
-
161
-
162
-
163
-
164
-
165
-
166
-
167
-
168
-
169
-
170
-
171
-
172
-
173
-
174
-
175
-
176
-
177
-
178
-
179
-
180
-
181
-
182
-
183
-
184
-
185
-
186
-
187
-
188
-
189
-
190
-
191
-
192
-
193
-
194
-
195
-
196
-
197
-
198
-
199
-
 200
200 -
 201
201 -
 202
202 -
 203
203 -
 204
204 -
 205
205 -
 206
206 -
 207
207 -
 208
208 -
 209
209 -
 210
210 -
 211
211 -
 212
212 -
 213
213 -
 214
214 -
 215
215 -
 216
216 -
 217
217 -
 218
218 -
 219
219 -
 220
220 -
221
-
222
-
223
-
224
-
225
-
226
-
227
-
228
-
229
-
230
-
231
-
232
-
233
-
234
-
235
-
236
-
237
-
238
-
239
-
240
-
241
-
242
-
243
-
244
-
245
-
246
-
247
-
248
-
249
-
250
-
251
-
252
-
253
-
254
-
255
-
256
-
257
-
258
-
259
-
260
 |
 |

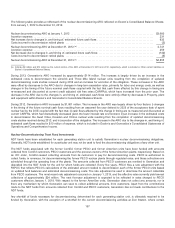
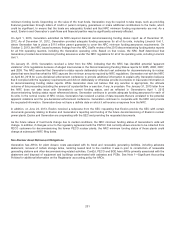
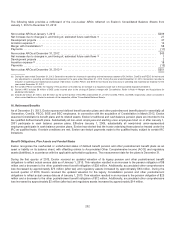
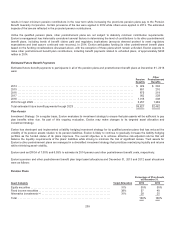
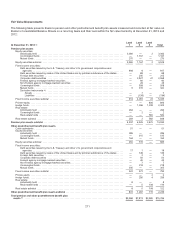
Thefollowingtablesprovidethe projectedbenefitobligations (PBO), accumulatedbenefitobligation (ABO), andfairvalue ofplan
assetsfor all pension planswithaPBO or ABO inexcess ofplan assets.
PBO in
excess of plan assets
2013 2012
Projectedbenefitobligation ................................................................. $15,452$16,800
Fairvalue ofnet plan assets ................................................................ 13,564 13,357
ABO in
excess of plan assets
2013 2012
Projectedbenefitobligation ................................................................. $15,452$16,796
Accumulatedbenefitobligation .............................................................. 14,55215,657
Fairvalue ofnet plan assets ................................................................ 13,564 13,353
OnaPBO basis, the planswere fundedat 88% at December 31,2013 comparedto 80%at December 31,2012.OnanABO basis,
the planswere fundedat 93%at December 31,2013 comparedto 85% at December 31,2012.TheABO differsfromthePBO inthat
theABO includesno assumption about future compensation levels.
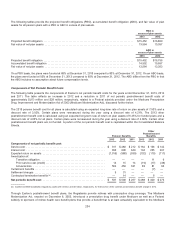
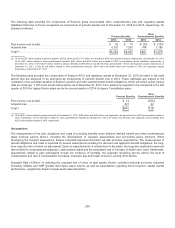
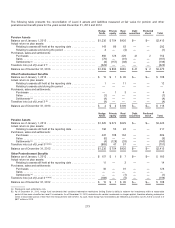
Components of Net Periodic Benefit Costs
Thefollowingtable presentsthecomponentsofExelon’s net periodic benefitcostsfor theyearsendedDecember 31,2013,2012
and2011.Thetable reflectsan increasein 2012 andareduction in 2011 ofnet periodic postretirement benefitcostsof
approximately$(17) million and$28million,respectively, relatedto a Federal subsidy providedunder theMedicare Prescription
Drug, Improvement andModernization Actof2003 (Medicare Modernization Act), discussedfurther below.
The 2013 pension benefitcostfor all plansiscalculatedusingan expectedlong-termrate ofreturn on plan assetsof 7.50%anda
discount rate of3.92%. Certain planswere remeasuredduringtheyear usingadiscount rate of4.21%. The 2013 other
postretirement benefitcostis calculatedusingan expectedlong-termrate ofreturn on plan assetsof 6.45% for fundedplansanda
discount rate of4.00%for all plans. Certain planswere remeasuredduringtheyear usingadiscount rate of 4.66%. Certainother
postretirement benefit plansare not funded. A portion ofthe net periodic benefitcostis capitalizedwithintheConsolidatedBalance
Sheets.
Pension Benefits
Other
Postretirement
Benefits
2013 2012 2011 2013 2012 2011
Components of net periodic benefit cost:
Servicecost......................................................... $ 317$280$212 $162$156 $ 142
Interestcost......................................................... 650698 649 194 205207
Expectedreturn on assets ............................................. (1,015) (988) (939) (132)(115) (111)
Amortization of:
Transition obligation ............................................... ———— 11 9
Prior servicecost(credit)........................................... 141514(19) (17) (38)
Actuarial loss .................................................... 562450 331 838166
Curtailment benefits................................................... ———— (7)—
Settlement charges ................................................... 9 31 ————
Contractual termination benefits(a)....................................... — 14— — 6—
Net periodic benefit cost ............................................. $ 537$500 $267 $ 288 $ 320 $275
(a)ComEd and BGE establishedregulatoryassetsof$1million and$4million,respectively, for their portion ofthecontractual termination benefitchargein 2012.
Through Exelon’s postretirement benefit plans, theRegistrantsprovide retireeswithprescription drugcoverage.TheMedicare
Modernization Act,enactedon December 8, 2003,introduceda prescription drugbenefitunder Medicare aswell asaFederal
subsidy to sponsorsofretiree healthcare benefit plansthat provideabenefitthat is at leastactuariallyequivalent to theMedicare
204