ComEd 2013 Annual Report Download - page 68
Download and view the complete annual report
Please find page 68 of the 2013 ComEd annual report below. You can navigate through the pages in the report by either clicking on the pages listed below, or by using the keyword search tool below to find specific information within the annual report.-
 1
1 -
2
-
3
-
4
-
5
-
6
-
7
-
8
-
9
-
10
-
11
-
12
-
13
-
14
-
15
-
16
-
17
-
18
-
19
-
20
-
21
-
22
-
23
-
24
-
25
-
26
-
27
-
28
-
29
-
30
-
31
-
32
-
33
-
34
-
35
-
36
-
37
-
38
-
39
-
40
-
41
-
42
-
43
-
44
-
45
-
46
-
47
-
48
-
49
-
50
-
51
-
52
-
53
-
54
-
55
-
56
-
57
-
 58
58 -
 59
59 -
 60
60 -
 61
61 -
 62
62 -
 63
63 -
 64
64 -
 65
65 -
 66
66 -
 67
67 -
 68
68 -
 69
69 -
 70
70 -
 71
71 -
 72
72 -
 73
73 -
 74
74 -
 75
75 -
 76
76 -
 77
77 -
 78
78 -
79
-
80
-
81
-
82
-
83
-
84
-
85
-
86
-
87
-
88
-
89
-
90
-
91
-
92
-
93
-
94
-
95
-
96
-
97
-
98
-
99
-
100
-
101
-
102
-
103
-
104
-
105
-
106
-
107
-
108
-
109
-
110
-
111
-
112
-
113
-
114
-
115
-
116
-
117
-
118
-
119
-
120
-
121
-
122
-
123
-
124
-
125
-
126
-
127
-
128
-
129
-
130
-
131
-
132
-
133
-
134
-
135
-
136
-
137
-
138
-
139
-
140
-
141
-
142
-
143
-
144
-
145
-
146
-
147
-
148
-
149
-
150
-
151
-
152
-
153
-
154
-
155
-
156
-
157
-
158
-
159
-
160
-
161
-
162
-
163
-
164
-
165
-
166
-
167
-
168
-
169
-
170
-
171
-
172
-
173
-
174
-
175
-
176
-
177
-
178
-
179
-
180
-
181
-
182
-
183
-
184
-
185
-
186
-
187
-
188
-
189
-
190
-
191
-
192
-
193
-
194
-
195
-
196
-
197
-
198
-
199
-
200
-
201
-
202
-
203
-
204
-
205
-
206
-
207
-
208
-
209
-
210
-
211
-
212
-
213
-
214
-
215
-
216
-
217
-
218
-
219
-
220
-
221
-
222
-
223
-
224
-
225
-
226
-
227
-
228
-
229
-
230
-
231
-
232
-
233
-
234
-
235
-
236
-
237
-
238
-
239
-
240
-
241
-
242
-
243
-
244
-
245
-
246
-
247
-
248
-
249
-
250
-
251
-
252
-
253
-
254
-
255
-
256
-
257
-
258
-
259
-
260
 |
 |

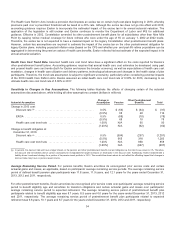
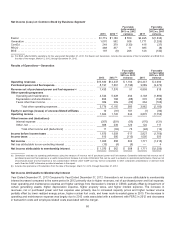
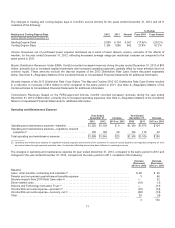
For theyear endedDecember 31,2013 comparedto 2012 and2012 comparedto 2011,Generation’s revenue net ofpurchased
power andfuel expenseby region were asfollows:
2013 vs. 2012 2012 vs. 2011
2013 2012 (a) Variance % Change 2011 Variance % Change
Mid-Atlantic (b)(f) ........................................ $3,270$3,433 $(163) (4.7)% $3,350$832.5%
Midwest(c) ............................................ 2,586 2,998 (412)(13.7)% 3,547 (549) (15.5)%
NewEngland ......................................... 185 196 (11) (5.6)% 9 187 n.m.
NewYork(f) ........................................... (4) 76 (80)(105.3)% — 76 n.m.
ERCOT .............................................. 43640531 7.7% 84 321 n.m.
Other Regions(d) ...................................... 201 131 7053.4% (14) 145 n.m.
Total electric revenue net ofpurchasedpower andfuel
expense............................................ $6,674 $7,239 $(565) (7.8)% $6,976 $ 2633.8%
ProprietaryTrading .................................... (8) (14) 6 42.9% 24(38) n.m.
Mark-to-market gains(losses)............................ 504515(11)(2.1)% (288) 803 n.m.
Other (e).............................................. 263(364) 627n.m. 146 (510)n.m.
Total revenue net ofpurchasedpower andfuel expense...... $7,433 $7,376 $ 57 0.8% $6,858 $ 518 7.6%
(a)Includesresultsfor Constellation business transferredto Generation beginningon March 12,2012,thedate themerger wascompleted.
(b) Resultsoftransactionswith PECO and BGE are includedintheMid-Atlantic region.
(c) ResultsoftransactionswithComEd are includedintheMidwestregion.
(d) Other RegionsincludesSouth, WestandCanada, which are not consideredindividually significant.
(e)Other representsactivitiesnot allocatedto a region.See textabovefor a description ofincludedactivities. Alsoincludesamortization ofintangible assetsrelatedto
commoditycontractsrecordedat fairvalue at merger date of $488 million and$1,098 million pre-taxfor thetwelvemonths endedDecember 31,2013 and
December 31,2012,respectively.
(f) Includes $542million and $450million ofpurchasedpower from CENG intheMid-Atlantic andNewYorkregions, respectively, for theyear endedDecember 31,
2013.Includes $487 million and$306million ofpurchasedpower from CENG intheMid-Atlantic andNewYorkregions, respectively, for theyear ended
December 31,2012.See Note 25oftheCombinedNotesto ConsolidatedFinancial Statementsfor additional information.
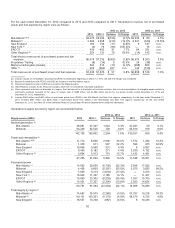
Generation’s supplysourcesbyregion are summarizedbelow:
2013 vs. 2012 2012 vs. 2011
Supply source (GWh) 2013 2012 (a) Variance % Change 2011 Variance % Change
Nuclear generation (b)
Mid-Atlantic .............................. 48,88147,3371,544 3.3% 47,287 500.1%
Midwest................................. 93,245 92,525720 0.8% 92,010 5150.6%
142,126139,8622,264 1.6% 139,297 565 0.4%
Fossilandrenewables(b)
Mid-Atlantic (b)(d) .......................... 11,714 8,8082,90633.0% 7,5721,23616.3%
Midwest................................. 1,478 97150752.2% 596 375 62.9%
NewEngland ............................ 10,896 9,965 931 9.3% 8 9,957 n.m.
ERCOT ................................. 6,4536,1822714.4% 2,030 4,152n.m.
Other Regions(e)......................... 6,664 5,913 75112.7% 1,432 4,481n.m.
37,20531,8395,366 16.9% 11,63820,201 n.m.
Purchasedpower
Mid-Atlantic (c) ............................ 14,09220,830 (6,738) (32.3)% 2,898 17,932 n.m.
Midwest................................. 4,408 9,805 (5,397) (55.0)% 5,9703,835 64.2%
NewEngland ............................ 7,655 9,273(1,618) (17.4)% — 9,273n.m.
NewYork(c) .............................. 13,64211,457 2,185 19.1%—11,457 n.m.
ERCOT ................................. 15,06323,302 (8,239) (35.4)% 7,53715,765 n.m.
Other Regions(e)......................... 14,931 17,327(2,396) (13.8)% 2,503 14,824n.m.
69,79191,994 (22,203)(24.1)% 18,90873,086 n.m.
Total supplybyregion (f)
Mid-Atlantic (g) ............................ 74,687 76,975 (2,288) (3.0)% 57,757 19,21833.3%
Midwest(h) ............................... 99,131 103,301 (4,170) (4.0)% 98,576 4,725 4.8%
NewEngland ............................ 18,55119,238 (687) (3.6)% 8 19,230 n.m.
62