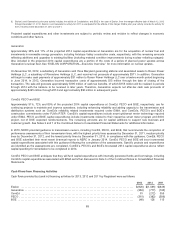
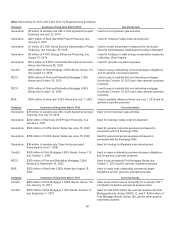
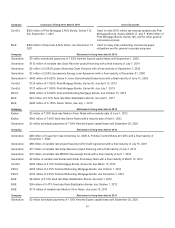
ComEd 2013 Annual Report Download - page 105
Download and view the complete annual report
Please find page 105 of the 2013 ComEd annual report below. You can navigate through the pages in the report by either clicking on the pages listed below, or by using the keyword search tool below to find specific information within the annual report.-
 1
1 -
2
-
3
-
4
-
5
-
6
-
7
-
8
-
9
-
10
-
11
-
12
-
13
-
14
-
15
-
16
-
17
-
18
-
19
-
20
-
21
-
22
-
23
-
24
-
25
-
26
-
27
-
28
-
29
-
30
-
31
-
32
-
33
-
34
-
35
-
36
-
37
-
38
-
39
-
40
-
41
-
42
-
43
-
44
-
45
-
46
-
47
-
48
-
49
-
50
-
51
-
52
-
53
-
54
-
55
-
56
-
57
-
58
-
59
-
60
-
61
-
62
-
63
-
64
-
65
-
66
-
67
-
68
-
69
-
70
-
71
-
72
-
73
-
74
-
75
-
76
-
77
-
78
-
79
-
80
-
81
-
82
-
83
-
84
-
85
-
86
-
87
-
88
-
89
-
90
-
91
-
92
-
93
-
94
-
 95
95 -
 96
96 -
 97
97 -
 98
98 -
 99
99 -
 100
100 -
 101
101 -
 102
102 -
 103
103 -
 104
104 -
 105
105 -
 106
106 -
 107
107 -
 108
108 -
 109
109 -
 110
110 -
 111
111 -
 112
112 -
 113
113 -
 114
114 -
 115
115 -
116
-
117
-
118
-
119
-
120
-
121
-
122
-
123
-
124
-
125
-
126
-
127
-
128
-
129
-
130
-
131
-
132
-
133
-
134
-
135
-
136
-
137
-
138
-
139
-
140
-
141
-
142
-
143
-
144
-
145
-
146
-
147
-
148
-
149
-
150
-
151
-
152
-
153
-
154
-
155
-
156
-
157
-
158
-
159
-
160
-
161
-
162
-
163
-
164
-
165
-
166
-
167
-
168
-
169
-
170
-
171
-
172
-
173
-
174
-
175
-
176
-
177
-
178
-
179
-
180
-
181
-
182
-
183
-
184
-
185
-
186
-
187
-
188
-
189
-
190
-
191
-
192
-
193
-
194
-
195
-
196
-
197
-
198
-
199
-
200
-
201
-
202
-
203
-
204
-
205
-
206
-
207
-
208
-
209
-
210
-
211
-
212
-
213
-
214
-
215
-
216
-
217
-
218
-
219
-
220
-
221
-
222
-
223
-
224
-
225
-
226
-
227
-
228
-
229
-
230
-
231
-
232
-
233
-
234
-
235
-
236
-
237
-
238
-
239
-
240
-
241
-
242
-
243
-
244
-
245
-
246
-
247
-
248
-
249
-
250
-
251
-
252
-
253
-
254
-
255
-
256
-
257
-
258
-
259
-
260
 |
 |

fee which includesashareholder return component andan incremental costcomponent.However,through December 2016, BGE
providesall residential electric customersacreditfor theresidential shareholder return component oftheadministrativecharge.
BGE hasalso enteredinto derivative natural gascontracts, which qualify for the normal purchasesandnormal salesscope
exception,to hedgeitspricerisk inthe natural gasmarket.Thehedgingprogramfor natural gasprocurement hasno directimpact
on BGE’s financial position.However,under BGE’s market-basedratesincentivemechanism, BGE’s actual costofgasiscompared
to a market index(ameasure ofthemarket priceofgasinagiven period). Thedifferencebetween BGE’s actual costandthemarket
indexissharedequallybetween shareholdersandcustomers.
BGE doesnot enter into derivativesfor speculative or proprietarytradingpurposes. For additional information on thesecontracts,
see Note 12 oftheCombinedNotesto ConsolidatedFinancial Statements.
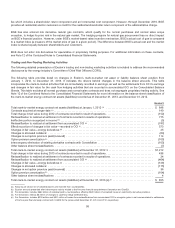
Trading and Non-Trading Marketing Activities
Thefollowingdetailedpresentation ofExelon’s tradingandnon-tradingmarketingactivitiesisincludedto address therecommended
disclosuresbythe energy industry’s Committee of ChiefRisk Officers (CCRO).
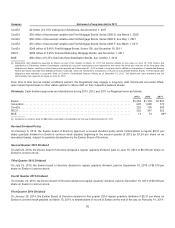
Thefollowingtable providesdetailonchangesinExelon’s mark-to-market net asset or liabilitybalancesheet position from
January1,2012,to December 31,2013.Itindicatesthedriversbehindchangesinthebalancesheet amounts. This table
incorporatesthemark-to-market activitiesthat are immediatelyrecordedin earnings, aswell asthesettlementsfrom OCI to earnings
andchangesinfairvalue for thecash flowhedgingactivitiesthat are recordedinaccumulated OCI on theConsolidatedBalance
Sheets. This table excludesall normal purchaseandnormal salescontractsanddoesnot segregate proprietarytradingactivity. See
Note 12 oftheCombinedNotesto theConsolidatedFinancial Statementsfor more information on thebalancesheet classification of
themark-to-market energy contract net assets(liabilities) recordedasofDecember 31,2013,andDecember 31,2012.
Exelon(b)
Total mark-to-market energy contract net assets(liabilities) at January1,2012 (a).................................. $ 848
Contractsacquiredat merger date (c) ........................................................................ 140
Total changeinfairvalue during2012 ofcontractsrecordedinresult ofoperations.................................. (152)
Reclassification to realizedat settlement ofcontractsrecordedinresultsofoperations............................... 775
Ineffective portion recognizedinincome(d) ................................................................... (5)
Reclassification to realizedat settlement fromaccumulated OCI (e)............................................... (747)
Effective portion ofchangesinfairvalue—recordedinOCI (f) .................................................... 573
Changesinfairvalue—energy derivatives(g) ................................................................. 25
Changesin allocatedcollateral ............................................................................ (89)
Changesin net option premiumpaid/(received) ............................................................... 114
Option premiumamortization (h) ............................................................................ (160)
Intercompanyelimination ofexistingderivativecontractswithConstellation ........................................ (103)
Other balancesheet reclassifications ....................................................................... (7)
Total mark-to-market energy contract net assets(liabilities) at December 31,2012 (a)................................ $1,212
Total changeinfairvalue during2013 ofcontractsrecordedinresult ofoperations.................................. 438
Reclassification to realizedat settlement ofcontractsrecordedinresultsofoperations............................... 34
Reclassification to realizedat settlement fromaccumulated OCI (e)............................................... (464)
Changesinfairvalue—energy derivatives(g) ................................................................. (126)
Changesin allocatedcollateral ............................................................................ (175)
Changesin net option premiumpaid/(received) ............................................................... 36
Option premiumamortization (h) ............................................................................ (104)
Other balancesheet reclassifications ....................................................................... 4
Total mark-to-market energy contract net assets(liabilities) at December 31,2013 (a)(i) ............................. $ 855
(a)Amountsare shown net ofcollateral paid to andreceivedfromcounterparties.
(b) Excelon amountspresentedafter intercompanyactivityrelatedto thefive-year financial swap between Generation andComEd.
(c) For Generation,includes $660million ofcollateral paid to counterparties, offset by $520 million ofunrealizedlosseson commodityderivativepositions.
(d) For Generation,reflects$5million ofchangesincash flowhedgeineffectiveness.
(e)For Generation,includes$219million and$621 million oflossesfromreclassificationsfromaccumulated OCI to recognizegainsin net income relatedto settlements
ofthefive-year financial swap contractwithComEd for theyearsendedDecember 31,2013 and2012,respectively.
99