ComEd 2013 Annual Report Download - page 85
Download and view the complete annual report
Please find page 85 of the 2013 ComEd annual report below. You can navigate through the pages in the report by either clicking on the pages listed below, or by using the keyword search tool below to find specific information within the annual report.-
 1
1 -
2
-
3
-
4
-
5
-
6
-
7
-
8
-
9
-
10
-
11
-
12
-
13
-
14
-
15
-
16
-
17
-
18
-
19
-
20
-
21
-
22
-
23
-
24
-
25
-
26
-
27
-
28
-
29
-
30
-
31
-
32
-
33
-
34
-
35
-
36
-
37
-
38
-
39
-
40
-
41
-
42
-
43
-
44
-
45
-
46
-
47
-
48
-
49
-
50
-
51
-
52
-
53
-
54
-
55
-
56
-
57
-
58
-
59
-
60
-
61
-
62
-
63
-
64
-
65
-
66
-
67
-
68
-
69
-
70
-
71
-
72
-
73
-
74
-
 75
75 -
 76
76 -
 77
77 -
 78
78 -
 79
79 -
 80
80 -
 81
81 -
 82
82 -
 83
83 -
 84
84 -
 85
85 -
 86
86 -
 87
87 -
 88
88 -
 89
89 -
 90
90 -
 91
91 -
 92
92 -
 93
93 -
 94
94 -
 95
95 -
96
-
97
-
98
-
99
-
100
-
101
-
102
-
103
-
104
-
105
-
106
-
107
-
108
-
109
-
110
-
111
-
112
-
113
-
114
-
115
-
116
-
117
-
118
-
119
-
120
-
121
-
122
-
123
-
124
-
125
-
126
-
127
-
128
-
129
-
130
-
131
-
132
-
133
-
134
-
135
-
136
-
137
-
138
-
139
-
140
-
141
-
142
-
143
-
144
-
145
-
146
-
147
-
148
-
149
-
150
-
151
-
152
-
153
-
154
-
155
-
156
-
157
-
158
-
159
-
160
-
161
-
162
-
163
-
164
-
165
-
166
-
167
-
168
-
169
-
170
-
171
-
172
-
173
-
174
-
175
-
176
-
177
-
178
-
179
-
180
-
181
-
182
-
183
-
184
-
185
-
186
-
187
-
188
-
189
-
190
-
191
-
192
-
193
-
194
-
195
-
196
-
197
-
198
-
199
-
200
-
201
-
202
-
203
-
204
-
205
-
206
-
207
-
208
-
209
-
210
-
211
-
212
-
213
-
214
-
215
-
216
-
217
-
218
-
219
-
220
-
221
-
222
-
223
-
224
-
225
-
226
-
227
-
228
-
229
-
230
-
231
-
232
-
233
-
234
-
235
-
236
-
237
-
238
-
239
-
240
-
241
-
242
-
243
-
244
-
245
-
246
-
247
-
248
-
249
-
250
-
251
-
252
-
253
-
254
-
255
-
256
-
257
-
258
-
259
-
260
 |
 |

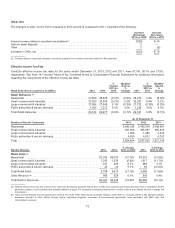
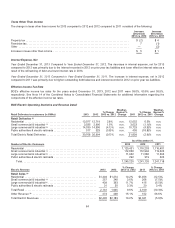
As of December 31,
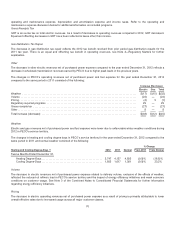
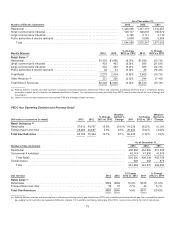
Number of Electric Customers 2013 2012 2011
Residential .................................................................... 1,423,068 1,417,7731,415,681
Small commercial &industrial ..................................................... 149,117148,803 148,570
Largecommercial &industrial ..................................................... 3,1053,111 3,110
Public authorities&electric railroads ............................................... 9,668 9,6609,689
Total ...................................................................... 1,584,958 1,579,347 1,577,050
Electric Revenue 2013 2012
% Change
2013 vs. 2012 2011
% Change
2012 vs. 2011
Retail Sales (a)
Residential .................................................... $1,592$1,689 (5.7)% $1,934(12.7)%
Small commercial &industrial .................................... 433 462(6.3)% 585 (21.0)%
Largecommercial &industrial .................................... 224232 (3.4)% 308(24.7)%
Public authorities&electric railroads............................... 30 31 (3.2)% 38(18.4)%
Total Retail.................................................... 2,279 2,414 (5.6)% 2,865 (15.7)%
Other Revenue (b) .............................................. 221 226(2.2)% 244 (7.4)%
Total Electric Revenues ......................................... $2,500 $2,640(5.3)% $3,109(15.1)%
(a)Reflectsdeliveryvolumesandrevenuesfromcustomerspurchasingelectricitydirectlyfrom PECO andcustomerspurchasingelectricityfromacompetitive electric
generation supplier asall customersare assessed distribution charges. For customerspurchasingelectricityfrom PECO, revenue alsoreflectsthecostofenergy and
transmission.
(b) Other revenue includestransmission revenue from PJM andwholesale electric revenues.
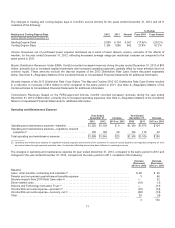
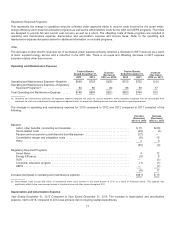
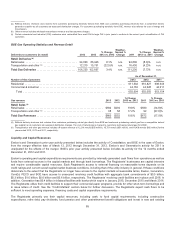
PECO Gas Operating Statistics and Revenue Detail
Deliveries to customers (in mmcf) 2013 2012
% Change
2013 vs. 2012
Weather-
Normal %
Change 2011
% Change
2012 vs. 2011
Weather-
Normal %
Change
Retail Deliveries (b)
Retailsales .................................... 57,613 49,767 15.8% (0.1)% 54,239 (8.2)% (0.1)%
Transportation andother ......................... 28,089 26,687 5.3%0.5% 28,204 (5.4)% (4.8)%
Total Gas Deliveries ............................ 85,702 76,454 12.1%0.1%82,443(7.3)% (1.6)%
As of December 31,
Number of Gas Customers 2013 2012 2011
Residential ......................................................................... 458,356 454,502 451,382
Commercial &industrial .............................................................. 42,174 41,83641,373
Total Retail..................................................................... 500,530 496,338492,755
Transportation ...................................................................... 909903 879
Total .......................................................................... 501,439 497,241493,634
Gas revenue 2013 2012
% Change
2013 vs. 2012 2011
% Change
2012 vs. 2011
Retail Sales (a)
Retailsales ........................................................ $562$50910.4% $576 (11.6)%
Transportation andother ............................................. 38372.7% 35 5.7%
Total Gas Revenues ................................................ $600 $546 9.9% $611 (10.6)%
(a)Reflectsdeliveryvolumesandrevenuesfromcustomerspurchasingnatural gasdirectlyfrom PECO andcustomerspurchasingnatural gasfromacompetitive natural
gassupplier asall customersare assessed distribution charges. For customerspurchasingnatural gasfrom PECO, revenue alsoreflectsthecostofnatural gas.
79