ComEd 2013 Annual Report Download - page 158
Download and view the complete annual report
Please find page 158 of the 2013 ComEd annual report below. You can navigate through the pages in the report by either clicking on the pages listed below, or by using the keyword search tool below to find specific information within the annual report.-
 1
1 -
2
-
3
-
4
-
5
-
6
-
7
-
8
-
9
-
10
-
11
-
12
-
13
-
14
-
15
-
16
-
17
-
18
-
19
-
20
-
21
-
22
-
23
-
24
-
25
-
26
-
27
-
28
-
29
-
30
-
31
-
32
-
33
-
34
-
35
-
36
-
37
-
38
-
39
-
40
-
41
-
42
-
43
-
44
-
45
-
46
-
47
-
48
-
49
-
50
-
51
-
52
-
53
-
54
-
55
-
56
-
57
-
58
-
59
-
60
-
61
-
62
-
63
-
64
-
65
-
66
-
67
-
68
-
69
-
70
-
71
-
72
-
73
-
74
-
75
-
76
-
77
-
78
-
79
-
80
-
81
-
82
-
83
-
84
-
85
-
86
-
87
-
88
-
89
-
90
-
91
-
92
-
93
-
94
-
95
-
96
-
97
-
98
-
99
-
100
-
101
-
102
-
103
-
104
-
105
-
106
-
107
-
108
-
109
-
110
-
111
-
112
-
113
-
114
-
115
-
116
-
117
-
118
-
119
-
120
-
121
-
122
-
123
-
124
-
125
-
126
-
127
-
128
-
129
-
130
-
131
-
132
-
133
-
134
-
135
-
136
-
137
-
138
-
139
-
140
-
141
-
142
-
143
-
144
-
145
-
146
-
147
-
 148
148 -
 149
149 -
 150
150 -
 151
151 -
 152
152 -
 153
153 -
 154
154 -
 155
155 -
 156
156 -
 157
157 -
 158
158 -
 159
159 -
 160
160 -
 161
161 -
 162
162 -
 163
163 -
 164
164 -
 165
165 -
 166
166 -
 167
167 -
 168
168 -
169
-
170
-
171
-
172
-
173
-
174
-
175
-
176
-
177
-
178
-
179
-
180
-
181
-
182
-
183
-
184
-
185
-
186
-
187
-
188
-
189
-
190
-
191
-
192
-
193
-
194
-
195
-
196
-
197
-
198
-
199
-
200
-
201
-
202
-
203
-
204
-
205
-
206
-
207
-
208
-
209
-
210
-
211
-
212
-
213
-
214
-
215
-
216
-
217
-
218
-
219
-
220
-
221
-
222
-
223
-
224
-
225
-
226
-
227
-
228
-
229
-
230
-
231
-
232
-
233
-
234
-
235
-
236
-
237
-
238
-
239
-
240
-
241
-
242
-
243
-
244
-
245
-
246
-
247
-
248
-
249
-
250
-
251
-
252
-
253
-
254
-
255
-
256
-
257
-
258
-
259
-
260
 |
 |

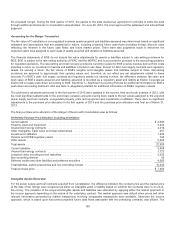
Duringtheyear endedDecember 31,2013,Exelon,Generation,ComEd, PECO and BGE incurredmerger andintegration-related
costsof$142million,$106million,$16million,$9million and$6million,respectively. Of theseamounts, Exelon,ComEd and BGE
deferred$17million,$11 million and$6million,respectively, asaregulatoryasset asofDecember 31,2013.Additionally, Exelon
and BGE establishedaregulatoryasset of$6million asofDecember 31,2013 for previouslyincurred2012 merger andintegration-
relatedcosts.
Duringtheyear endedDecember 31,2012,Exelon,Generation,ComEd, PECO and BGE incurredmerger andintegration-related
costsof$804million,$340million,$41million,$17million and$182million,respectively. Of theseamounts, Exelon,ComEd and
BGE deferred $58 million,$36million and$22 million,respectively, asaregulatoryasset asofDecember 31,2012.
Thecostsincurredare classifiedprimarilywithinOperatingandMaintenanceExpenseintheRegistrants’ respectiveConsolidated
StatementsofOperationsandComprehensiveIncome,withtheexception oftheBGE customer rate creditandthecreditfacility
fees, which are includedasareduction to operatingrevenuesandother,net,respectively, for yearsendedDecember 31,2013 and
2012.See Note 22—CommitmentsandContingenciesfor additional information.
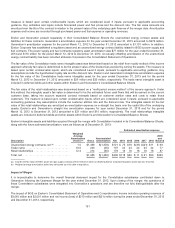
Pro-forma Impact of the Merger
Thefollowingunauditedpro formafinancial information reflectstheconsolidatedresultsofoperationsofExelon andGeneration asif
themerger withConstellation hadtaken placeonJanuary1,2011.The unauditedpro formainformation wascalculatedafter
applyingExelon’s andGeneration’s accountingpoliciesandadjustingConstellation’s resultsto reflect purchaseaccounting
adjustments.
The unauditedpro formafinancial information hasbeen presentedfor illustrative purposesonlyandisnot necessarilyindicativeof
resultsofoperationsthat wouldhavebeen achievedhadthemerger eventstaken placeonthedatesindicated, or thefuture
consolidatedresultsofoperationsofthecombinedcompany.
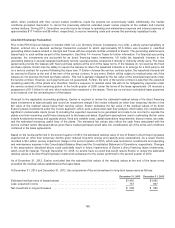
Year Ended December 31,
(unaudited) 2012 2011 (a)
Total Revenues........................................................................... $26,700 $30,712
Net income attributable to Exelon ............................................................ 2,092974
Basic Earnings Per Share .................................................................. $ 2.56 $ 1.15
DilutedEarnings Per Share ................................................................. 2.55 1.14
(a)Theamountsaboveinclude non-recurringcostsdirectlyrelatedto themerger of$236million for theyear endedDecember 31,2011.
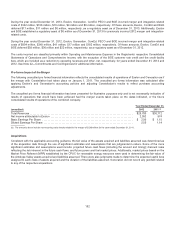
Acquisitions
Consistent withthe applicable accountingguidance,thefairvalue oftheassetsacquiredandliabilitiesassumedwasdeterminedas
oftheacquisition date through theuseof significant estimatesandassumptionsthat are judgmental in nature.Someofthemore
significant estimatesandassumptionsusedinclude:projectedfuture cash flows (includingtheamount andtiming); discount rates
reflectingtherisk inherent inthefuture cash flows; andfuture power andfuel market prices. Additionally, market pricesbasedon the
Market PriceReferent (MPR)establishedbytheCPUC for renewable energy resourceswere usedindeterminingthefairvalue of
the Antelope Valleyassetsacquiredandliabilitiesassumed. There were alsojudgmentsmadetodetermine theexpecteduseful lives
assignedto each class ofassetsacquiredandtheduration oftheliabilitiesassumed. Generation did not recordanygoodwill related
to anyoftherespectiveacquisitions.
152