ComEd 2013 Annual Report Download - page 75
Download and view the complete annual report
Please find page 75 of the 2013 ComEd annual report below. You can navigate through the pages in the report by either clicking on the pages listed below, or by using the keyword search tool below to find specific information within the annual report.-
 1
1 -
2
-
3
-
4
-
5
-
6
-
7
-
8
-
9
-
10
-
11
-
12
-
13
-
14
-
15
-
16
-
17
-
18
-
19
-
20
-
21
-
22
-
23
-
24
-
25
-
26
-
27
-
28
-
29
-
30
-
31
-
32
-
33
-
34
-
35
-
36
-
37
-
38
-
39
-
40
-
41
-
42
-
43
-
44
-
45
-
46
-
47
-
48
-
49
-
50
-
51
-
52
-
53
-
54
-
55
-
56
-
57
-
58
-
59
-
60
-
61
-
62
-
63
-
64
-
 65
65 -
 66
66 -
 67
67 -
 68
68 -
 69
69 -
 70
70 -
 71
71 -
 72
72 -
 73
73 -
 74
74 -
 75
75 -
 76
76 -
 77
77 -
 78
78 -
 79
79 -
 80
80 -
 81
81 -
 82
82 -
 83
83 -
 84
84 -
 85
85 -
86
-
87
-
88
-
89
-
90
-
91
-
92
-
93
-
94
-
95
-
96
-
97
-
98
-
99
-
100
-
101
-
102
-
103
-
104
-
105
-
106
-
107
-
108
-
109
-
110
-
111
-
112
-
113
-
114
-
115
-
116
-
117
-
118
-
119
-
120
-
121
-
122
-
123
-
124
-
125
-
126
-
127
-
128
-
129
-
130
-
131
-
132
-
133
-
134
-
135
-
136
-
137
-
138
-
139
-
140
-
141
-
142
-
143
-
144
-
145
-
146
-
147
-
148
-
149
-
150
-
151
-
152
-
153
-
154
-
155
-
156
-
157
-
158
-
159
-
160
-
161
-
162
-
163
-
164
-
165
-
166
-
167
-
168
-
169
-
170
-
171
-
172
-
173
-
174
-
175
-
176
-
177
-
178
-
179
-
180
-
181
-
182
-
183
-
184
-
185
-
186
-
187
-
188
-
189
-
190
-
191
-
192
-
193
-
194
-
195
-
196
-
197
-
198
-
199
-
200
-
201
-
202
-
203
-
204
-
205
-
206
-
207
-
208
-
209
-
210
-
211
-
212
-
213
-
214
-
215
-
216
-
217
-
218
-
219
-
220
-
221
-
222
-
223
-
224
-
225
-
226
-
227
-
228
-
229
-
230
-
231
-
232
-
233
-
234
-
235
-
236
-
237
-
238
-
239
-
240
-
241
-
242
-
243
-
244
-
245
-
246
-
247
-
248
-
249
-
250
-
251
-
252
-
253
-
254
-
255
-
256
-
257
-
258
-
259
-
260
 |
 |

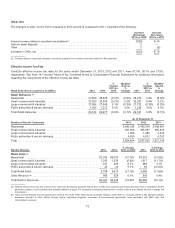
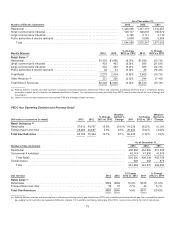
All ComEd customershavethechoice to purchase electricityfromacompetitive electric generation supplier.Customer choice
programs do not impactComEd’s volumeofdeliveries, but doaffectComEd’s operatingrevenuesrelatedto suppliedenergy, which
is fullyoffset in purchasedpower expense.Therefore,customer choice programs havenoimpactonrevenuesnet ofpurchased
power expense.
Thenumber ofretailcustomersparticipatingincustomer choice programs was2,630,185, 1,627,150and380,262atDecember 31,
2013,2012 and2011,respectively, representing 68%, 43%and10%oftotal retailcustomers, respectively. Retail energy purchased
fromcompetitive electric generation suppliersrepresented81%, 65% and 56% ofComEd’s retailkWh salesfor theyearsended
December 31,2013,2012 and2011,respectively. During2012,theCityof Chicagoandapproximately240Illinois municipalities,
includinggovernmental entitiessuch astownshipsandcounties, approvedreferendaregardingelectric supplyaggregation.The
referenda allowedgovernmental officialsto identify and signcontractswithcompetitive electric generation supplierson behalfofthe
eligible retailcustomersinthecommunity, while also allowingcustomersto opt-out ofthemunicipal aggregation program. Asof
December 31,2013,there are approximately330 municipalitiesthat have approvedamunicipal aggregation referenduminthe
ComEd service territory. Asaresult,approximately 69% ofresidential usageasofDecember 31,2013 is beingsuppliedby
competitive electric generation suppliers, andComEd estimatesthat over 80%ofthat usageresultedfrommunicipal aggregation
activities.
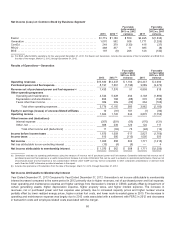
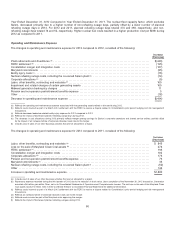
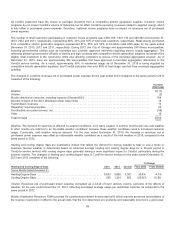
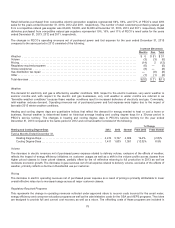
ThechangesinComEd’s revenuesnet ofpurchasedpower expensefor theyear ended2013 comparedto thesame periodin 2012
consistedofthefollowing:
Increase
(Decrease)
Weather ............................................................................................. $(17)
Volume.............................................................................................. (2)
Electric distribution revenues, includingimpactsofSenate Bill 9 ............................................... 168
Discrete impactsofthe 2012 Distribution Rate CaseOrder ................................................... 13
Transmission revenues ................................................................................ 14
Regulatoryrequiredprograms ........................................................................... 20
Uncollectible accountsrecovery, net ...................................................................... (58)
Other ............................................................................................... 16
Total increase........................................................................................ $154
Weather. Thedemandfor electricityisaffectedbyweather conditions. Verywarmweather insummer months andverycoldweather
inother months are referredto as“favorable weather conditions” becausetheseweather conditionsresult inincreasedcustomer
usage.Conversely, mildweather reducesdemand. For theyear endedDecember 31,2013,theincreaseinrevenuesnet of
purchasedpower expensewasoffset by unfavorable weather conditionsasaresult ofthemildweather in 2013,comparedto the
same periodin 2012.
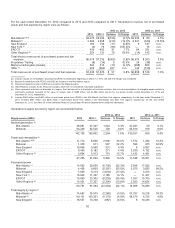
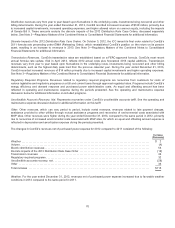
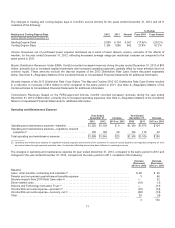
Heatingandcoolingdegree days are quantitativeindicesthat reflectthedemandfor energy neededto heat or cool a homeor
business. Normal weather is determinedbasedon historical averageheatingandcoolingdegree days for a 30-year periodin
ComEd’s service territorywithcoolingdegree days generallyhavingamore significant impacttoComEd, particularlyduringthe
summer months. Thechangesinheatingandcoolingdegree days inComEd’s service territoryfor theyearsendedDecember 31,
2013 and2012 consistedofthefollowing:
% Change
Heating and Cooling Degree-Days 2013 2012 Normal From 2012 From Normal
TwelveMonths EndedDecember 31,
HeatingDegree-Days .............................................. 6,603 5,065 6,34130.4% 4.1%
CoolingDegree-Days .............................................. 933 1,324842(29.5)% 10.8%
Volume. Revenuesnet ofpurchasedpower expensedecreasedasaresult oflower deliveryvolume,exclusiveoftheeffectsof
weather,for theyear endedDecember 31,2013,reflectingdecreasedaverageusage per residential customer ascomparedto the
same periodin 2012.
Electric Distribution Revenues. EIMA providesfor a performance-basedformula rate tariff, which requiresan annual reconciliation of
therevenue requirement ineffecttotheactual coststhat theICC determinesare prudentlyandreasonablyincurredinagiven year.
69