ComEd 2013 Annual Report Download - page 40
Download and view the complete annual report
Please find page 40 of the 2013 ComEd annual report below. You can navigate through the pages in the report by either clicking on the pages listed below, or by using the keyword search tool below to find specific information within the annual report.-
 1
1 -
2
-
3
-
4
-
5
-
6
-
7
-
8
-
9
-
10
-
11
-
12
-
13
-
14
-
15
-
16
-
17
-
18
-
19
-
20
-
21
-
22
-
23
-
24
-
25
-
26
-
27
-
28
-
29
-
 30
30 -
 31
31 -
 32
32 -
 33
33 -
 34
34 -
 35
35 -
 36
36 -
 37
37 -
 38
38 -
 39
39 -
 40
40 -
 41
41 -
 42
42 -
 43
43 -
 44
44 -
 45
45 -
 46
46 -
 47
47 -
 48
48 -
 49
49 -
 50
50 -
51
-
52
-
53
-
54
-
55
-
56
-
57
-
58
-
59
-
60
-
61
-
62
-
63
-
64
-
65
-
66
-
67
-
68
-
69
-
70
-
71
-
72
-
73
-
74
-
75
-
76
-
77
-
78
-
79
-
80
-
81
-
82
-
83
-
84
-
85
-
86
-
87
-
88
-
89
-
90
-
91
-
92
-
93
-
94
-
95
-
96
-
97
-
98
-
99
-
100
-
101
-
102
-
103
-
104
-
105
-
106
-
107
-
108
-
109
-
110
-
111
-
112
-
113
-
114
-
115
-
116
-
117
-
118
-
119
-
120
-
121
-
122
-
123
-
124
-
125
-
126
-
127
-
128
-
129
-
130
-
131
-
132
-
133
-
134
-
135
-
136
-
137
-
138
-
139
-
140
-
141
-
142
-
143
-
144
-
145
-
146
-
147
-
148
-
149
-
150
-
151
-
152
-
153
-
154
-
155
-
156
-
157
-
158
-
159
-
160
-
161
-
162
-
163
-
164
-
165
-
166
-
167
-
168
-
169
-
170
-
171
-
172
-
173
-
174
-
175
-
176
-
177
-
178
-
179
-
180
-
181
-
182
-
183
-
184
-
185
-
186
-
187
-
188
-
189
-
190
-
191
-
192
-
193
-
194
-
195
-
196
-
197
-
198
-
199
-
200
-
201
-
202
-
203
-
204
-
205
-
206
-
207
-
208
-
209
-
210
-
211
-
212
-
213
-
214
-
215
-
216
-
217
-
218
-
219
-
220
-
221
-
222
-
223
-
224
-
225
-
226
-
227
-
228
-
229
-
230
-
231
-
232
-
233
-
234
-
235
-
236
-
237
-
238
-
239
-
240
-
241
-
242
-
243
-
244
-
245
-
246
-
247
-
248
-
249
-
250
-
251
-
252
-
253
-
254
-
255
-
256
-
257
-
258
-
259
-
260
 |
 |

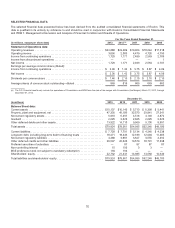
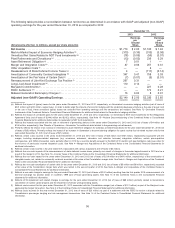
The Years Ended
December 31, Favorable
(Unfavorable)
Variance2013 2012
Equity in earnings/(losses) of unconsolidated affiliates .................................. 10 (91)101
Operating income ................................................................... 3,656 2,3801,276
Other income and (deductions)
Interestexpense,net ............................................................. (1,356) (928) (428)
Other,net ....................................................................... 473346 127
Total other incomeand(deductions) ............................................. (883) (582)(301)
Income (loss) before income taxes .................................................... 2,7731,798 975
Income taxes ....................................................................... 1,044 627(417)
Net income (loss) ................................................................... 1,7291,171558
Net (loss) income attributable to noncontrollinginterests, preferredsecurity dividends and
preferencestock dividends........................................................... 10 11 1
Net income (loss) on common stock .................................................. $ 1,719$1,160$ 559
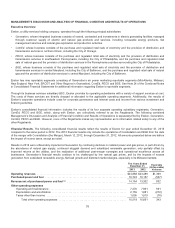
(a)TheRegistrants’ evaluate operatingperformanceusingthemeasure ofrevenue net ofpurchasedpower andfuel expense.TheRegistrants’ believethat revenue net
ofpurchasedpower andfuel expenseis auseful measurement becauseit providesinformation that can beusedto evaluate itsoperational performance.Revenue
net ofpurchasedpower andfuel expenseis not a presentation definedunder GAAPandmaynot becomparable to other companies’ presentationsor deemedmore
useful than theGAAPinformation providedelsewhere inthis report.
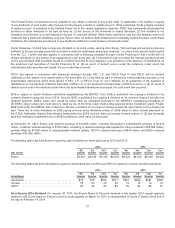
Exelon’s net incomeoncommon stock was$1,719million for theyear endedDecember 31,2013 ascomparedto $1,160million for
theyear endedDecember 31,2012,anddilutedearnings per averagecommon share were $2.00 for theyear endedDecember 31,
2013 ascomparedto $1.42for theyear endedDecember 31,2012.
Operatingrevenuesnet ofpurchasedpower andfuel expense, which is a non-GAAPmeasure discussedbelow, increasedby$832
million ascomparedto 2012.Theyear-over-year increasein operatingrevenue net ofpurchasedpower andfuel expensereflects
theinclusion ofConstellation and BGE’s resultsfor thefull periodin 2013 andwasprimarilydue to thefollowingfavorable factors:
•DecreaseinGeneration’s amortization expensefor theacquiredenergy contractsrecordedat fairvalue at themerger date of
$610 million;
•IncreaseinBGE’s revenue net ofpurchasedpower andfuel expenseof$278 million,primarilyasaresult oftheinclusion of
BGE’s resultsfor thefull periodin 2013,accrual oftheresidential customer rate creditthat wasacondition oftheMDPSC’s
approval ofExelon’s merger withConstellation in 2012,andtheimpactoftheMDPSC approvedelectric andnatural gas
distribution rate increasesthat becameeffectiveFebruary23,2013;
•IncreaseinGeneration’s revenue net ofpurchasedpower andfuel of$159 million on other activities, includingproprietary
trading, retailgas, energy efficiency, energy management anddemandresponse,upstreamnatural gasandthedesignand
construction ofcustomer sitedsolar facilities, primarilydue to theaddition ofConstellation;and
•IncreaseinComEd’s revenue net ofpurchasedpower expenseof$154 million primarilydue to increased distribution revenue
due to recoveryofincreasedcostsandcapital investment and higher allowedROE pursuant to theformula rate under EIMAand
the enactment ofSenate Bill 9.
Theyear-over-year increasein operatingrevenue net ofpurchasedpower andfuel expensewaspartiallyoffset by thefollowing
unfavorable factors:
•DecreaseinGeneration’s electric revenue net ofpurchasedpower andfuel expenseof $565 million primarilydue to lower
realizedenergy prices, lower loadvolumeandincreasednuclear fuel expense,partiallyoffset by higher capacityrevenue,
increasednuclear volumes, andlower energy supplycostsasaresult oftheintegration ofthe energy generation andload
servingbusinessesfollowingthemerger;
•Reducedrevenue net ofpurchasedpower andfuel at Generation of$136million in 2013 associatedwiththeMarylandClean
Coal assetsthat were soldinNovember 2012 andlostcompensation on the reliability-must-run programwith PJM for retired
fossilgeneratingassetsthat expiredon May31,2012;and
•DecreaseinPECO’s revenue net ofpurchasedpower andfuel expenseof$11 million primarilydue to thedecreaseineffective
ratesdue to increasedusage per customer across all customer classes, decreasedcostrecoveryfor energy efficiency and
34