ComEd 2013 Annual Report Download - page 83
Download and view the complete annual report
Please find page 83 of the 2013 ComEd annual report below. You can navigate through the pages in the report by either clicking on the pages listed below, or by using the keyword search tool below to find specific information within the annual report.-
 1
1 -
2
-
3
-
4
-
5
-
6
-
7
-
8
-
9
-
10
-
11
-
12
-
13
-
14
-
15
-
16
-
17
-
18
-
19
-
20
-
21
-
22
-
23
-
24
-
25
-
26
-
27
-
28
-
29
-
30
-
31
-
32
-
33
-
34
-
35
-
36
-
37
-
38
-
39
-
40
-
41
-
42
-
43
-
44
-
45
-
46
-
47
-
48
-
49
-
50
-
51
-
52
-
53
-
54
-
55
-
56
-
57
-
58
-
59
-
60
-
61
-
62
-
63
-
64
-
65
-
66
-
67
-
68
-
69
-
70
-
71
-
72
-
 73
73 -
 74
74 -
 75
75 -
 76
76 -
 77
77 -
 78
78 -
 79
79 -
 80
80 -
 81
81 -
 82
82 -
 83
83 -
 84
84 -
 85
85 -
 86
86 -
 87
87 -
 88
88 -
 89
89 -
 90
90 -
 91
91 -
 92
92 -
 93
93 -
94
-
95
-
96
-
97
-
98
-
99
-
100
-
101
-
102
-
103
-
104
-
105
-
106
-
107
-
108
-
109
-
110
-
111
-
112
-
113
-
114
-
115
-
116
-
117
-
118
-
119
-
120
-
121
-
122
-
123
-
124
-
125
-
126
-
127
-
128
-
129
-
130
-
131
-
132
-
133
-
134
-
135
-
136
-
137
-
138
-
139
-
140
-
141
-
142
-
143
-
144
-
145
-
146
-
147
-
148
-
149
-
150
-
151
-
152
-
153
-
154
-
155
-
156
-
157
-
158
-
159
-
160
-
161
-
162
-
163
-
164
-
165
-
166
-
167
-
168
-
169
-
170
-
171
-
172
-
173
-
174
-
175
-
176
-
177
-
178
-
179
-
180
-
181
-
182
-
183
-
184
-
185
-
186
-
187
-
188
-
189
-
190
-
191
-
192
-
193
-
194
-
195
-
196
-
197
-
198
-
199
-
200
-
201
-
202
-
203
-
204
-
205
-
206
-
207
-
208
-
209
-
210
-
211
-
212
-
213
-
214
-
215
-
216
-
217
-
218
-
219
-
220
-
221
-
222
-
223
-
224
-
225
-
226
-
227
-
228
-
229
-
230
-
231
-
232
-
233
-
234
-
235
-
236
-
237
-
238
-
239
-
240
-
241
-
242
-
243
-
244
-
245
-
246
-
247
-
248
-
249
-
250
-
251
-
252
-
253
-
254
-
255
-
256
-
257
-
258
-
259
-
260
 |
 |

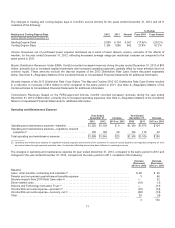
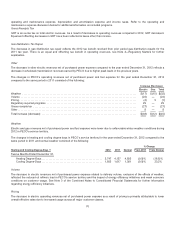
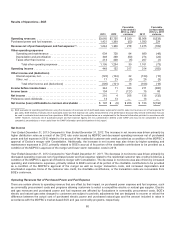
Regulatory Required Programs
This representsthechangein operatingrevenuescollectedunder approvedridersto recover costsincurredfor thesmart meter,
energy efficiency andconsumer education programs aswell astheadministrativecostsfor theGSAandAEPS programs. Theriders
are designedto providefull andcurrent costrecoveryaswell asa return.Theoffsettingcostsofthese programs are includedin
operatingandmaintenanceexpense,depreciation andamortization expenseandincometaxes. Refer to the operatingand
maintenanceexpensediscussion belowfor additional information on includedprograms.
Other
Thedecreaseinother electric revenuesnet ofpurchasedpower expenseprimarilyreflectedadecreaseinGRTrevenuesasaresult
oflower suppliedenergy serviceandareduction intheGRTrate.There is an equal andoffsettingdecreaseinGRTexpense
includedintaxesother than income.
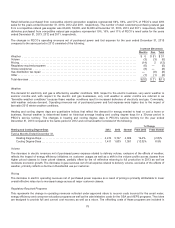
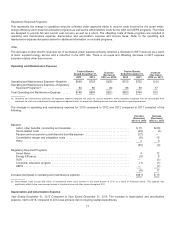
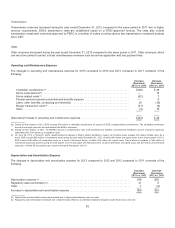
Operating and Maintenance Expense
Twelve Months
Ended December 31, Increase
(Decrease)
2013 vs. 2012
Twelve Months
Ended December 31, Increase
(Decrease)
2012 vs. 20112013 2012 2012 2011
OperatingandMaintenanceExpense—Baseline . . $668 $723 $(55) $723 $725$(2)
OperatingandMaintenanceExpense—Regulatory
RequiredPrograms (a)..................... 8086 (6) 86 69 17
Total OperatingandMaintenanceExpense....... $748 $809 $(61)$809 $794 $15
(a)Operatingandmaintenanceexpensesfor regulatoryrequiredprograms are costsfor variouslegislativeand/or regulatoryprograms that are recoverable from
customerson a full andcurrent basis through approvedregulatedrates. An equal andoffsettingamount hasbeen reflectedin operatingrevenues.
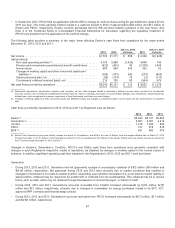
Thechangesin operatingandmaintenanceexpensefor 2013 comparedto 2012 and2012 comparedto 2011 consistedofthe
following:
Increase
(Decrease)
2013 vs. 2012
Increase
(Decrease)
2012 vs. 2011
Baseline
Labor,other benefits, contractingandmaterials.......................................... $ 10 $(29)
Storm-relatedcosts................................................................. (49) 9(a)
Pension andnon-pension postretirement benefitsexpense................................ (12)—
Constellation merger andintegration costs.............................................. (8) 15
Other ............................................................................ 4 3
(55) (2)
RegulatoryRequiredPrograms
Smart Meter ....................................................................... 4 12
Energy Efficiency................................................................... (9) 8
GSA............................................................................. — (1)
Consumer education program ........................................................ (1)(1)
AEPS ............................................................................ — (1)
(6) 17
Increase(decrease)in operatingandmaintenanceexpense................................... $(61)$15
(a)Storm-relatedcostsinclude$46 million ofincremental stormcostsincurredinthefourthquarter of2012 asaresult ofHurricane Sandy. This expensewas
significantlyoffset by thecostsincurredrelatedto Hurricane Irene andother storms throughout 2011.
Depreciation and Amortization Expense
Year Ended December 31, 2013 Compared to Year Ended December 31, 2012. Theincreaseindepreciation andamortization
expense,net for 2013,comparedto 2012 wasprimarilydue to ongoingcapital expenditures.
77