ComEd 2013 Annual Report Download - page 115
Download and view the complete annual report
Please find page 115 of the 2013 ComEd annual report below. You can navigate through the pages in the report by either clicking on the pages listed below, or by using the keyword search tool below to find specific information within the annual report.-
 1
1 -
2
-
3
-
4
-
5
-
6
-
7
-
8
-
9
-
10
-
11
-
12
-
13
-
14
-
15
-
16
-
17
-
18
-
19
-
20
-
21
-
22
-
23
-
24
-
25
-
26
-
27
-
28
-
29
-
30
-
31
-
32
-
33
-
34
-
35
-
36
-
37
-
38
-
39
-
40
-
41
-
42
-
43
-
44
-
45
-
46
-
47
-
48
-
49
-
50
-
51
-
52
-
53
-
54
-
55
-
56
-
57
-
58
-
59
-
60
-
61
-
62
-
63
-
64
-
65
-
66
-
67
-
68
-
69
-
70
-
71
-
72
-
73
-
74
-
75
-
76
-
77
-
78
-
79
-
80
-
81
-
82
-
83
-
84
-
85
-
86
-
87
-
88
-
89
-
90
-
91
-
92
-
93
-
94
-
95
-
96
-
97
-
98
-
99
-
100
-
101
-
102
-
103
-
104
-
 105
105 -
 106
106 -
 107
107 -
 108
108 -
 109
109 -
 110
110 -
 111
111 -
 112
112 -
 113
113 -
 114
114 -
 115
115 -
 116
116 -
 117
117 -
 118
118 -
 119
119 -
 120
120 -
 121
121 -
 122
122 -
 123
123 -
 124
124 -
 125
125 -
126
-
127
-
128
-
129
-
130
-
131
-
132
-
133
-
134
-
135
-
136
-
137
-
138
-
139
-
140
-
141
-
142
-
143
-
144
-
145
-
146
-
147
-
148
-
149
-
150
-
151
-
152
-
153
-
154
-
155
-
156
-
157
-
158
-
159
-
160
-
161
-
162
-
163
-
164
-
165
-
166
-
167
-
168
-
169
-
170
-
171
-
172
-
173
-
174
-
175
-
176
-
177
-
178
-
179
-
180
-
181
-
182
-
183
-
184
-
185
-
186
-
187
-
188
-
189
-
190
-
191
-
192
-
193
-
194
-
195
-
196
-
197
-
198
-
199
-
200
-
201
-
202
-
203
-
204
-
205
-
206
-
207
-
208
-
209
-
210
-
211
-
212
-
213
-
214
-
215
-
216
-
217
-
218
-
219
-
220
-
221
-
222
-
223
-
224
-
225
-
226
-
227
-
228
-
229
-
230
-
231
-
232
-
233
-
234
-
235
-
236
-
237
-
238
-
239
-
240
-
241
-
242
-
243
-
244
-
245
-
246
-
247
-
248
-
249
-
250
-
251
-
252
-
253
-
254
-
255
-
256
-
257
-
258
-
259
-
260
 |
 |

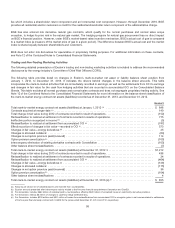
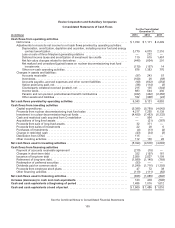
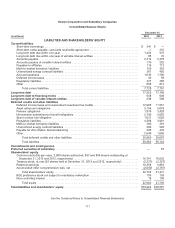
Exelon Corporation and Subsidiary Companies
Consolidated Statements of Cash Flows For the Years Ended
December 31,
(In millions) 2013 2012 2011
Cash flows from operating activities
Net income.................................................................. $1,729$1,171$2,499
Adjustmentsto reconcile net income to net cash flows providedbyoperatingactivities:
Depreciation,amortization,depletion andaccretion,includingnuclear fuel andenergy
contractamortization ..................................................... 3,779 4,079 2,316
Loss on sale ofthree Marylandgeneratingstations ............................. — 272—
Deferredincometaxesandamortization ofinvestment taxcredits ................. 1196151,457
Net fairvalue changesrelatedto derivatives ................................... (445) (604) 291
Net realizedandunrealized(gains) losseson nuclear decommissioningtrustfund
investments ............................................................ (170)(157) 14
Other non-cash operatingactivities........................................... 876 1,383770
Changesina
ssetsandliabilities:
Accountsreceivable ....................................................... (97) 24357
Inventories ............................................................... (100)26 (58)
Accountspayable,accruedexpensesandother current liabilities .................. (90)(632)(254)
Option premiums paid, net .................................................. (36) (114) (3)
Counterpartycollateral received(posted), net .................................. 215135(344)
Incometaxes ............................................................. 883544 492
Pension andnon-pension postretirement benefitcontributions .................... (422) (462)(2,360)
Other assetsandliabilities .................................................. 102 (368) (24)
Net cash flows provided by operating activities ..................................... 6,3436,131 4,853
Cash flows from investing activities
Capital expenditures........................................................... (5,395) (5,789) (4,042)
Proceeds fromnuclear decommissioningtrustfundsales ............................ 4,2177,265 6,139
Investment innuclear decommissioningtrustfunds ................................. (4,450) (7,483) (6,332)
Cash andrestrictedcash acquiredfromConstellation ............................... — 964 —
Acquisitionsoflonglivedassets ................................................. — (21)(387)
Proceeds fromsale oflong-livedassets ........................................... 32 371—
Proceeds fromsalesofinvestments .............................................. 22 286
Purchasesofinvestments ...................................................... (4) (13) (4)
Changeinrestrictedcash ...................................................... (43)(34) (3)
Distribution from CENG ........................................................ 115— —
Other investingactivities ....................................................... 112 13620
Net cash flows used in investing activities .......................................... (5,394) (4,576) (4,603)
Cash flows from financing activities
Payment ofaccountsreceivable agreement ....................................... (210)(15) —
Changesinshort-termdebt..................................................... 332 (197) 161
Issuanceoflong-termdebt..................................................... 2,055 2,0271,199
Retirement oflong-termdebt.................................................... (1,589) (1,145) (789)
Redemption ofpreferredsecurities ............................................... (93)— —
Dividends paid on common stock ................................................ (1,249) (1,716) (1,393)
Proceeds fromemployee stock plans............................................. 47 7238
Other financingactivities ....................................................... (119) (111)(62)
Net cash flows used in financing activities .......................................... (826) (1,085) (846)
Increase (decrease) in cash and cash equivalents ................................... 123 470(596)
Cash and cash equivalents at beginning of period ................................... 1,486 1,0161,612
Cash and cash equivalents at end of period ......................................... $1,609$1,486 $ 1,016
See theCombinedNotesto ConsolidatedFinancial Statements
109