ComEd 2013 Annual Report Download - page 213
Download and view the complete annual report
Please find page 213 of the 2013 ComEd annual report below. You can navigate through the pages in the report by either clicking on the pages listed below, or by using the keyword search tool below to find specific information within the annual report.-
 1
1 -
2
-
3
-
4
-
5
-
6
-
7
-
8
-
9
-
10
-
11
-
12
-
13
-
14
-
15
-
16
-
17
-
18
-
19
-
20
-
21
-
22
-
23
-
24
-
25
-
26
-
27
-
28
-
29
-
30
-
31
-
32
-
33
-
34
-
35
-
36
-
37
-
38
-
39
-
40
-
41
-
42
-
43
-
44
-
45
-
46
-
47
-
48
-
49
-
50
-
51
-
52
-
53
-
54
-
55
-
56
-
57
-
58
-
59
-
60
-
61
-
62
-
63
-
64
-
65
-
66
-
67
-
68
-
69
-
70
-
71
-
72
-
73
-
74
-
75
-
76
-
77
-
78
-
79
-
80
-
81
-
82
-
83
-
84
-
85
-
86
-
87
-
88
-
89
-
90
-
91
-
92
-
93
-
94
-
95
-
96
-
97
-
98
-
99
-
100
-
101
-
102
-
103
-
104
-
105
-
106
-
107
-
108
-
109
-
110
-
111
-
112
-
113
-
114
-
115
-
116
-
117
-
118
-
119
-
120
-
121
-
122
-
123
-
124
-
125
-
126
-
127
-
128
-
129
-
130
-
131
-
132
-
133
-
134
-
135
-
136
-
137
-
138
-
139
-
140
-
141
-
142
-
143
-
144
-
145
-
146
-
147
-
148
-
149
-
150
-
151
-
152
-
153
-
154
-
155
-
156
-
157
-
158
-
159
-
160
-
161
-
162
-
163
-
164
-
165
-
166
-
167
-
168
-
169
-
170
-
171
-
172
-
173
-
174
-
175
-
176
-
177
-
178
-
179
-
180
-
181
-
182
-
183
-
184
-
185
-
186
-
187
-
188
-
189
-
190
-
191
-
192
-
193
-
194
-
195
-
196
-
197
-
198
-
199
-
200
-
201
-
202
-
 203
203 -
 204
204 -
 205
205 -
 206
206 -
 207
207 -
 208
208 -
 209
209 -
 210
210 -
 211
211 -
 212
212 -
 213
213 -
 214
214 -
 215
215 -
 216
216 -
 217
217 -
 218
218 -
 219
219 -
 220
220 -
 221
221 -
 222
222 -
 223
223 -
224
-
225
-
226
-
227
-
228
-
229
-
230
-
231
-
232
-
233
-
234
-
235
-
236
-
237
-
238
-
239
-
240
-
241
-
242
-
243
-
244
-
245
-
246
-
247
-
248
-
249
-
250
-
251
-
252
-
253
-
254
-
255
-
256
-
257
-
258
-
259
-
260
 |
 |

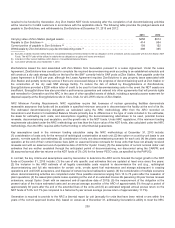
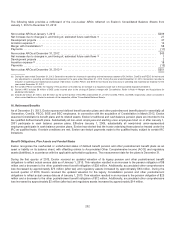
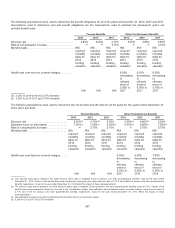
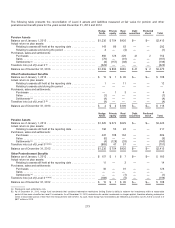
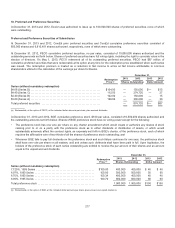
Thefollowingassumptionswere usedto determine thebenefitobligationsfor all ofthe plansat December 31,2013,2012 and2011.
Assumptionsusedto determine year-endbenefitobligationsare theassumptionsusedto estimate thesubsequent year’s net
periodic benefitcosts.
Pension Benefits Other Postretirement Benefits
2013 2012 2011 2013 2012 2011
Discount rate .................................. 4.80%3.92% 4.74% 4.90%4.00% 4.80%
Rate ofcompensation increase................... (a) (b) 3.75% (a) (b) 3.75%
Mortalitytable ................................. IRS
required
mortality
table for
2014
funding
valuation
IRS
required
mortality
table for
2013
funding
valuation
IRS
required
mortality
table for
2012
funding
valuation
IRS
required
mortality
table for
2014
funding
valuation
IRS
required
mortality
table for
2013
funding
valuation
IRS
required
mortality
table for
2012
funding
valuation
Healthcare cost trendon coveredcharges .........
N/AN/AN/A
6.00%
decreasing
to
ultimate
trendof
5.00%in
2017
6.50%
decreasing
to
ultimate
trendof
5.00%in
2017
6.50%
decreasing
to
ultimate
trendof
5.00%in
2017
(a)3.25% for 2014-2018and3.75% thereafter.
(b) 3.25% for 2013-2017and3.75% thereafter.
Thefollowingassumptionswere usedto determine the net periodic benefitcostsfor all the plansfor theyearsendedDecember 31,
2013,2012 and2011:
Pension Benefits Other Postretirement Benefits
2013 2012 2011 2013 2012 2011
Discount rate ............................. 3.92%(a)4.74%(b) 5.26% 4.00%(a)4.80%(b) 5.30%
Expectedreturn on plan assets .............. 7.50%(c) 7.50%(c) 8.00%(c) 6.45%(c) 6.68%(c) 7.08%(c)
Rate ofcompensation increase.............. (d) 3.75% 3.75% (d) 3.75% 3.75%
Mortalitytable ............................. IRS
required
mortality
table for
2013
funding
valuation
IRS
required
mortality
table for
2012
funding
valuation
IRS
required
mortality
table for
2011
funding
valuation
IRS
required
mortality
table for
2013
funding
valuation
IRS
required
mortality
table for
2012
funding
valuation
IRS
required
mortality
table for
2011
funding
valuation
Healthcare cost trendon coveredcharges.....
N/AN/AN/A
6.50%
decreasing
to
ultimate
trendof
5.00%in
2017
6.50%
decreasing
to
ultimate
trendof
5.00%in
2017
7.00%
decreasing
to
ultimate
trendof
5.00%in
2015
(a)Thediscount ratesabove represent theinitial discount ratesusedto establish Exelon’s pension andother postretirement benefitscostsfor theyear ended
December 31,2013.Certainofthebenefit planswere remeasuredduringtheyear using discount ratesof4.21%and 4.66% for pension andother postretirement
benefits, respectively. Costsfor theyear endedDecember 31,2013 reflecttheimpactoftheseremeasurements.
(b) Thediscount ratesabove represent theinitial discountsratesusedto establish Exelon’s pension andother postretirement benefitscostsfor 2012.Certainofthe
benefit planswere remeasuredduringtheyear due to theConstellation merger,plan settlement andcurtailment events, andplan changesusing discount ratesof
3.71%and3.72%for pension andother postretirement benefits, respectively. Costsfor theyear endedDecember 31,2012 reflecttheimpactofthese
remeasurements.
(c) Not applicable to pension andother postretirement benefit plansthat do not have plan assets.
(d) 3.25% for 2013-2017and3.75% thereafter.
207