ComEd 2013 Annual Report Download - page 38
Download and view the complete annual report
Please find page 38 of the 2013 ComEd annual report below. You can navigate through the pages in the report by either clicking on the pages listed below, or by using the keyword search tool below to find specific information within the annual report.-
 1
1 -
2
-
3
-
4
-
5
-
6
-
7
-
8
-
9
-
10
-
11
-
12
-
13
-
14
-
15
-
16
-
17
-
18
-
19
-
20
-
21
-
22
-
23
-
24
-
25
-
26
-
27
-
 28
28 -
 29
29 -
 30
30 -
 31
31 -
 32
32 -
 33
33 -
 34
34 -
 35
35 -
 36
36 -
 37
37 -
 38
38 -
 39
39 -
 40
40 -
 41
41 -
 42
42 -
 43
43 -
 44
44 -
 45
45 -
 46
46 -
 47
47 -
 48
48 -
49
-
50
-
51
-
52
-
53
-
54
-
55
-
56
-
57
-
58
-
59
-
60
-
61
-
62
-
63
-
64
-
65
-
66
-
67
-
68
-
69
-
70
-
71
-
72
-
73
-
74
-
75
-
76
-
77
-
78
-
79
-
80
-
81
-
82
-
83
-
84
-
85
-
86
-
87
-
88
-
89
-
90
-
91
-
92
-
93
-
94
-
95
-
96
-
97
-
98
-
99
-
100
-
101
-
102
-
103
-
104
-
105
-
106
-
107
-
108
-
109
-
110
-
111
-
112
-
113
-
114
-
115
-
116
-
117
-
118
-
119
-
120
-
121
-
122
-
123
-
124
-
125
-
126
-
127
-
128
-
129
-
130
-
131
-
132
-
133
-
134
-
135
-
136
-
137
-
138
-
139
-
140
-
141
-
142
-
143
-
144
-
145
-
146
-
147
-
148
-
149
-
150
-
151
-
152
-
153
-
154
-
155
-
156
-
157
-
158
-
159
-
160
-
161
-
162
-
163
-
164
-
165
-
166
-
167
-
168
-
169
-
170
-
171
-
172
-
173
-
174
-
175
-
176
-
177
-
178
-
179
-
180
-
181
-
182
-
183
-
184
-
185
-
186
-
187
-
188
-
189
-
190
-
191
-
192
-
193
-
194
-
195
-
196
-
197
-
198
-
199
-
200
-
201
-
202
-
203
-
204
-
205
-
206
-
207
-
208
-
209
-
210
-
211
-
212
-
213
-
214
-
215
-
216
-
217
-
218
-
219
-
220
-
221
-
222
-
223
-
224
-
225
-
226
-
227
-
228
-
229
-
230
-
231
-
232
-
233
-
234
-
235
-
236
-
237
-
238
-
239
-
240
-
241
-
242
-
243
-
244
-
245
-
246
-
247
-
248
-
249
-
250
-
251
-
252
-
253
-
254
-
255
-
256
-
257
-
258
-
259
-
260
 |
 |

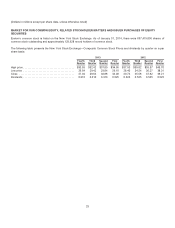
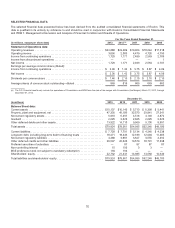
SELECTED FINANCIAL DATA
Theselectedfinancial data presentedbelowhasbeen derivedfromtheauditedconsolidatedfinancial statementsofExelon. This
data is qualifiedinitsentiretybyreferencetoandshouldbe readinconjunction withExelon’s ConsolidatedFinancial Statements
and ITEM 7. Management’s Discussion andAnalysis ofFinancial Condition andResultsofOperations.
For the Years Ended December 31,
(In millions, except per share data) 2013 2012 (a) 2011 2010 2009
Statement of Operations data:
Operatingrevenues ................................................. $24,888 $23,489 $19,063$18,644 $17,318
Operatingincome................................................... 3,656 2,3804,479 4,726 4,750
Incomefromcontinuingoperations ..................................... 1,7291,1712,499 2,5632,706
Incomefrom discontinuedoperations ................................... ———— 1
Net income........................................................ 1,7291,1712,499 2,5632,707
Earnings per averagecommon share (diluted):
Incomefromcontinuingoperations ..................................... $ 2.00 $1.42$3.75 $ 3.87 $ 4.09
Net income........................................................ $ 2.00 $1.42$3.75 $ 3.87 $ 4.09
Dividends per common share ......................................... $ 1.46 $ 2.10 $2.10 $2.10 $2.10
Averagesharesofcommon stock outstanding—diluted .................... 860819 665 663662
(a)The 2012 financial resultsonlyincludethe operationsofConstellation and BGE fromthedate ofthemerger withConstellation (theMerger), March 12,2012,through
December 31,2012.
December 31,
(In millions) 2013 2012 2011 2010 2009
Balance Sheet data:
Current assets...................................................... $10,137$10,140$ 5,713 $6,398 $ 5,441
Property, plant andequipment,net ..................................... 47,330 45,186 32,57029,94127,341
Noncurrent regulatoryassets.......................................... 5,910 6,497 4,5184,1404,872
Goodwill ........................................................... 2,6252,6252,6252,6252,625
Other deferreddebitsandother assets.................................. 13,922 14,113 9,569 9,136 8,901
Total assets........................................................ $79,924 $78,561$54,995 $52,240$49,180
Current liabilities .................................................... $ 7,728 $ 7,791$5,134$4,240$4,238
Long-termdebt,includinglong-termdebttofinancingtrusts ................ 18,27118,346 12,189 12,00411,385
Noncurrent regulatoryliabilities ........................................ 4,388 3,9813,6273,555 3,492
Other deferredcreditsandother liabilities ............................... 26,597 26,62619,57018,79117,338
Preferredsecuritiesofsubsidiary ...................................... — 87 87 87 87
Non-controllinginterest.............................................. 1510633—
BGE preferencestock not subjecttomandatoryredemption ................ 193193———
Shareholders’ equity................................................. 22,732 21,431 14,385 13,56012,640
Total liabilitiesandshareholders’ equity ................................. $79,924 $78,561$54,995 $52,240$49,180
32