ComEd 2013 Annual Report Download - page 171
Download and view the complete annual report
Please find page 171 of the 2013 ComEd annual report below. You can navigate through the pages in the report by either clicking on the pages listed below, or by using the keyword search tool below to find specific information within the annual report.-
 1
1 -
2
-
3
-
4
-
5
-
6
-
7
-
8
-
9
-
10
-
11
-
12
-
13
-
14
-
15
-
16
-
17
-
18
-
19
-
20
-
21
-
22
-
23
-
24
-
25
-
26
-
27
-
28
-
29
-
30
-
31
-
32
-
33
-
34
-
35
-
36
-
37
-
38
-
39
-
40
-
41
-
42
-
43
-
44
-
45
-
46
-
47
-
48
-
49
-
50
-
51
-
52
-
53
-
54
-
55
-
56
-
57
-
58
-
59
-
60
-
61
-
62
-
63
-
64
-
65
-
66
-
67
-
68
-
69
-
70
-
71
-
72
-
73
-
74
-
75
-
76
-
77
-
78
-
79
-
80
-
81
-
82
-
83
-
84
-
85
-
86
-
87
-
88
-
89
-
90
-
91
-
92
-
93
-
94
-
95
-
96
-
97
-
98
-
99
-
100
-
101
-
102
-
103
-
104
-
105
-
106
-
107
-
108
-
109
-
110
-
111
-
112
-
113
-
114
-
115
-
116
-
117
-
118
-
119
-
120
-
121
-
122
-
123
-
124
-
125
-
126
-
127
-
128
-
129
-
130
-
131
-
132
-
133
-
134
-
135
-
136
-
137
-
138
-
139
-
140
-
141
-
142
-
143
-
144
-
145
-
146
-
147
-
148
-
149
-
150
-
151
-
152
-
153
-
154
-
155
-
156
-
157
-
158
-
159
-
160
-
 161
161 -
 162
162 -
 163
163 -
 164
164 -
 165
165 -
 166
166 -
 167
167 -
 168
168 -
 169
169 -
 170
170 -
 171
171 -
 172
172 -
 173
173 -
 174
174 -
 175
175 -
 176
176 -
 177
177 -
 178
178 -
 179
179 -
 180
180 -
 181
181 -
182
-
183
-
184
-
185
-
186
-
187
-
188
-
189
-
190
-
191
-
192
-
193
-
194
-
195
-
196
-
197
-
198
-
199
-
200
-
201
-
202
-
203
-
204
-
205
-
206
-
207
-
208
-
209
-
210
-
211
-
212
-
213
-
214
-
215
-
216
-
217
-
218
-
219
-
220
-
221
-
222
-
223
-
224
-
225
-
226
-
227
-
228
-
229
-
230
-
231
-
232
-
233
-
234
-
235
-
236
-
237
-
238
-
239
-
240
-
241
-
242
-
243
-
244
-
245
-
246
-
247
-
248
-
249
-
250
-
251
-
252
-
253
-
254
-
255
-
256
-
257
-
258
-
259
-
260
 |
 |

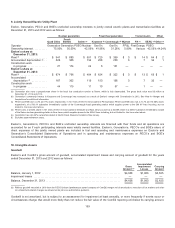
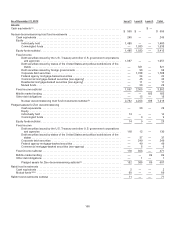
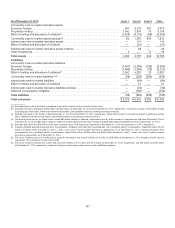
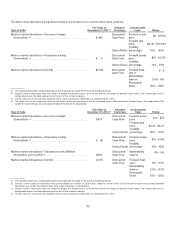
As of December 31, 2013 Level 1 Level 2 Level 3 Total
Rabbi trustinvestments
Cash equivalents ........................................................... 2—— 2
Mutual funds (d)(e)........................................................... 54 — — 54
Rabbi trustinvestmentssubtotal .................................................. 56 — — 56
Commoditymark-to-market derivativeassets
Economic hedges .............................................................. 4932,582885 3,960
Proprietarytrading .............................................................. 3241,315122 1,761
Effectofnettingandallocation ofcollateral (f) ........................................ (863)(3,131)(430) (4,424)
Commoditymark-to-market assetssubtotal ......................................... (46) 766 577 1,297
Interest rate mark-to-market derivativeassets ....................................... 30 39— 69
Effectofnettingandallocation ofcollateral .......................................... (30)(2)— (32)
Interest rate mark-to-market derivativeassetssubtotal ................................ — 37— 37
Other Investments .............................................................. — — 1515
Total assets .................................................................. 4,533 5,575 1,054 11,162
Liabilities
Commoditymark-to-market derivativeliabilities
Economic hedges .............................................................. (540)(1,890) (590)(3,020)
Proprietarytrading .............................................................. (328) (1,256) (119) (1,703)
Effectofnettingandallocation ofcollateral (f) ........................................ 869 3,0074044,280
Commoditymark-to-market liabilitiessubtotal (h) ...................................... 1(139) (305) (443)
Interest rate mark-to-market derivativeliabilities...................................... (31)(17) — (48)
Effectofnettingandallocation ofcollateral .......................................... 31 1 —32
Interest rate mark-to-market derivativeliabilitiessubtotal .............................. — (16) — (16)
Deferredcompensation obligation ................................................. — (114) — (114)
Total liabilities ................................................................ 1(269) (305) (573)
Total net assets ............................................................... $4,534$5,306 $ 749 $10,589
165