ComEd 2013 Annual Report Download - page 103
Download and view the complete annual report
Please find page 103 of the 2013 ComEd annual report below. You can navigate through the pages in the report by either clicking on the pages listed below, or by using the keyword search tool below to find specific information within the annual report.-
 1
1 -
2
-
3
-
4
-
5
-
6
-
7
-
8
-
9
-
10
-
11
-
12
-
13
-
14
-
15
-
16
-
17
-
18
-
19
-
20
-
21
-
22
-
23
-
24
-
25
-
26
-
27
-
28
-
29
-
30
-
31
-
32
-
33
-
34
-
35
-
36
-
37
-
38
-
39
-
40
-
41
-
42
-
43
-
44
-
45
-
46
-
47
-
48
-
49
-
50
-
51
-
52
-
53
-
54
-
55
-
56
-
57
-
58
-
59
-
60
-
61
-
62
-
63
-
64
-
65
-
66
-
67
-
68
-
69
-
70
-
71
-
72
-
73
-
74
-
75
-
76
-
77
-
78
-
79
-
80
-
81
-
82
-
83
-
84
-
85
-
86
-
87
-
88
-
89
-
90
-
91
-
92
-
 93
93 -
 94
94 -
 95
95 -
 96
96 -
 97
97 -
 98
98 -
 99
99 -
 100
100 -
 101
101 -
 102
102 -
 103
103 -
 104
104 -
 105
105 -
 106
106 -
 107
107 -
 108
108 -
 109
109 -
 110
110 -
 111
111 -
 112
112 -
 113
113 -
114
-
115
-
116
-
117
-
118
-
119
-
120
-
121
-
122
-
123
-
124
-
125
-
126
-
127
-
128
-
129
-
130
-
131
-
132
-
133
-
134
-
135
-
136
-
137
-
138
-
139
-
140
-
141
-
142
-
143
-
144
-
145
-
146
-
147
-
148
-
149
-
150
-
151
-
152
-
153
-
154
-
155
-
156
-
157
-
158
-
159
-
160
-
161
-
162
-
163
-
164
-
165
-
166
-
167
-
168
-
169
-
170
-
171
-
172
-
173
-
174
-
175
-
176
-
177
-
178
-
179
-
180
-
181
-
182
-
183
-
184
-
185
-
186
-
187
-
188
-
189
-
190
-
191
-
192
-
193
-
194
-
195
-
196
-
197
-
198
-
199
-
200
-
201
-
202
-
203
-
204
-
205
-
206
-
207
-
208
-
209
-
210
-
211
-
212
-
213
-
214
-
215
-
216
-
217
-
218
-
219
-
220
-
221
-
222
-
223
-
224
-
225
-
226
-
227
-
228
-
229
-
230
-
231
-
232
-
233
-
234
-
235
-
236
-
237
-
238
-
239
-
240
-
241
-
242
-
243
-
244
-
245
-
246
-
247
-
248
-
249
-
250
-
251
-
252
-
253
-
254
-
255
-
256
-
257
-
258
-
259
-
260
 |
 |
QUANTITATIVE AND QUALITATIVE DISCLOSURES ABOUT MARKET RISK
TheRegistrantsare exposedto market risks associatedwithadversechangesincommodityprices, counterpartycredit,interest
ratesandequityprices. Exelon’s RMC approvesrisk management policiesandobjectivesfor risk assessment,control andvaluation,
counterpartycredit approval,andthemonitoringandreportingofrisk exposures. TheRMC is chairedbythechiefrisk officer and
includesthechiefexecutiveofficer, chieffinancial officer,corporate controller,general counsel,treasurer, vice president ofstrategy,
vice president ofauditservicesandofficersrepresentingExelon’s business units. TheRMC reportsto therisk oversightcommittee
oftheExelon boardofdirectorson thescope oftherisk management activities.
Commodity Price Risk
Commoditypricerisk is associatedwithpricemovementsresultingfromchangesinsupplyanddemand, fuel costs, market liquidity,
weather conditions, governmental regulatoryandenvironmental policies, andother factors. Totheextent theamount ofenergy
Exelon generates differsfromtheamount ofenergy ithascontractedto sell,Exelon haspricerisk fromcommoditypricemovements.
Exelon seeks to mitigate itscommoditypricerisk through thesale andpurchaseofelectricity, fossilfuel,andother commodities.
Generation
Normal Operations and Hedging Activities. Electricityavailable fromGeneration’s ownedor contractedgeneration supplyin
excess ofGeneration’s obligationsto customers, includingportionsofComEd’s, PECO’s and BGE’s retail load, is soldinto the
wholesale markets. Toreducepricerisk causedbymarket fluctuations, Generation entersinto non-derivativecontractsaswell as
derivativecontracts, includingforwards, futures, swaps, andoptions, withapprovedcounterpartiesto hedge anticipatedexposures.
Generation believestheseinstrumentsrepresent economic hedgesthat mitigate exposure to fluctuationsincommodityprices.
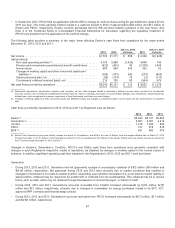
Generation expectsthesettlement ofthemajorityofitseconomic hedgeswill occur during2014through 2016.
Ingeneral,increasesanddecreasesinforwardmarket priceshaveapositiveandnegativeimpact,respectively, on Generation’s
ownedandcontractedgeneration positions which have not been hedged. Generation hedgescommodityrisk on a ratable basis over
thethree yearsleadingto thespot market.AsofDecember 31,2013,the percentageofexpectedgeneration hedgedfor themajor
reportable segmentswas92%-95%, 62%-65% and30%-33%for 2014, 2015and2016, respectively. The percentageofexpected
generation hedgedistheamount ofequivalent sales dividedbytheexpectedgeneration.Expectedgeneration representsthe
amount ofenergy estimatedto begeneratedor purchasedthrough ownedor contractedcapacity. Equivalent salesrepresent all
hedgingproducts, which includeeconomic hedgesandcertain non-derivativecontractsincludingsalesto ComEd, PECO and BGE
to servetheir retail load.
A portion ofGeneration’s hedgingstrategy maybeaccomplishedwithfuel productsbasedon assumedcorrelationsbetween power
andfuel prices, which routinelychangeinthemarket.Market pricerisk exposure is therisk ofachangeinthevalue ofunhedged
positions. Theforecastedmarket pricerisk exposure for Generation’s entire non-tradingportfolioassociatedwitha$5 reduction in
the annual average around-the-clock energy pricebasedon December 31,2013,market conditionsandhedgedposition wouldbea
decreasein pre-taxnet incomeofapproximately$30 million,$520 million and$820 million,respectively, for 2014, 2015and2016.
Power pricesensitivitiesare derivedbyadjustingpower priceassumptions while keepingall other priceinputsconstant.Generation
expectsto activelymanageitsportfoliotomitigate market pricerisk exposure for itsunhedgedposition.Actual resultscould differ
dependingon thespecific timingof, andmarketsaffected by, pricechanges, aswell asfuture changesinGeneration’s portfolio.
Proprietary Trading Activities. Generation also entersinto certain energy-relatedderivativesfor proprietarytradingpurposes.
Proprietarytradingincludesall contractsenteredinto withtheintent ofbenefitingfrom shiftsor changesinmarket pricesasopposed
to those enteredinto withtheintent ofhedgingor managingrisk. Proprietarytradingactivitiesare subjecttolimitsestablishedby
Exelon’s RMC. The proprietarytradingportfoliois subjecttoarisk management policy that includesstringent risk management
limits, includingvolume,stop loss andValue-at-Risk (VaR)limitsto manageexposure to market risk. Additionally, theExelon risk
management group andExelon’s RMC monitor thefinancial risks ofthe proprietarytradingactivities. The proprietarytrading
activities, which includedphysical volumesof 8,762GWh, 12,958 GWh, and 5,742GWh for theyearsendedDecember 31,2013,
2012 and2011 respectively, are a complement to Generation’s energy marketingportfolio,but represent a small portion of
Generation’s overall revenue fromenergy marketingactivities. Tradingportfolioactivityfor theyear endedDecember 31,2013,
resultedin pre-taxlossesof$8million due to net mark-to-market lossesof$39million andrealizedgainsof$31 million.Generation
usesa95% confidenceinterval,assumingstandardnormal distribution,one dayholdingperiod, one-tailedstatistical measure in
calculatingitsVaR.ThedailyVaR on proprietarytradingactivityaveraged$1.0million ofexposure duringtheyear.Generation has
97