Chrysler 2014 Annual Report Download - page 82
Download and view the complete annual report
Please find page 82 of the 2014 Chrysler annual report below. You can navigate through the pages in the report by either clicking on the pages listed below, or by using the keyword search tool below to find specific information within the annual report.-
 1
1 -
2
-
3
-
4
-
5
-
6
-
7
-
8
-
9
-
10
-
11
-
12
-
13
-
14
-
15
-
16
-
17
-
18
-
19
-
20
-
21
-
22
-
23
-
24
-
25
-
26
-
27
-
28
-
29
-
30
-
31
-
32
-
33
-
34
-
35
-
36
-
37
-
38
-
39
-
40
-
41
-
42
-
43
-
44
-
45
-
46
-
47
-
48
-
49
-
50
-
51
-
52
-
53
-
54
-
55
-
56
-
57
-
58
-
59
-
60
-
61
-
62
-
63
-
64
-
65
-
66
-
67
-
68
-
69
-
70
-
71
-
 72
72 -
 73
73 -
 74
74 -
 75
75 -
 76
76 -
 77
77 -
 78
78 -
 79
79 -
 80
80 -
 81
81 -
 82
82 -
 83
83 -
 84
84 -
 85
85 -
 86
86 -
 87
87 -
 88
88 -
 89
89 -
 90
90 -
 91
91 -
 92
92 -
93
-
94
-
95
-
96
-
97
-
98
-
99
-
100
-
101
-
102
-
103
-
104
-
105
-
106
-
107
-
108
-
109
-
110
-
111
-
112
-
113
-
114
-
115
-
116
-
117
-
118
-
119
-
120
-
121
-
122
-
123
-
124
-
125
-
126
-
127
-
128
-
129
-
130
-
131
-
132
-
133
-
134
-
135
-
136
-
137
-
138
-
139
-
140
-
141
-
142
-
143
-
144
-
145
-
146
-
147
-
148
-
149
-
150
-
151
-
152
-
153
-
154
-
155
-
156
-
157
-
158
-
159
-
160
-
161
-
162
-
163
-
164
-
165
-
166
-
167
-
168
-
169
-
170
-
171
-
172
-
173
-
174
-
175
-
176
-
177
-
178
-
179
-
180
-
181
-
182
-
183
-
184
-
185
-
186
-
187
-
188
-
189
-
190
-
191
-
192
-
193
-
194
-
195
-
196
-
197
-
198
-
199
-
200
-
201
-
202
-
203
-
204
-
205
-
206
-
207
-
208
-
209
-
210
-
211
-
212
-
213
-
214
-
215
-
216
-
217
-
218
-
219
-
220
-
221
-
222
-
223
-
224
-
225
-
226
-
227
-
228
-
229
-
230
-
231
-
232
-
233
-
234
-
235
-
236
-
237
-
238
-
239
-
240
-
241
-
242
-
243
-
244
-
245
-
246
-
247
-
248
-
249
-
250
-
251
-
252
-
253
-
254
-
255
-
256
-
257
-
258
-
259
-
260
-
261
-
262
-
263
-
264
-
265
-
266
-
267
-
268
-
269
-
270
-
271
-
272
-
273
-
274
-
275
-
276
-
277
-
278
-
279
-
280
-
281
-
282
-
283
-
284
-
285
-
286
-
287
-
288
-
289
-
290
-
291
-
292
-
293
-
294
-
295
-
296
-
297
-
298
-
299
-
300
-
301
-
302
-
303
 |
 |

80 2014 | ANNUAL REPORT
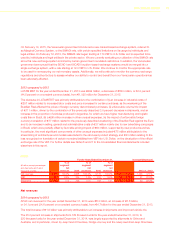
Operating Results
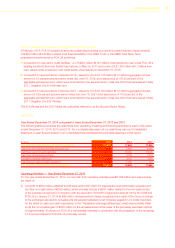
Total Available Liquidity
At December 31, 2014, our total available liquidity was €26.2 billion (€22.7 billion at December 31, 2013), including
€3.2 billion available under undrawn committed credit lines, primarily related to the €2.1 billion three year syndicated
revolving credit line and the U.S.$1.3 billion (approximately €1.1 billion) Revolving Credit Facility of FCA US. The terms of
the Revolving Credit Facility require FCA US to maintain a minimum liquidity of U.S.$3.0 billion (€2.5 billion), which include
any undrawn amounts under the Revolving Credit Facility. Total available liquidity includes cash and cash equivalents and
current securities. Total available liquidity is subject to intra-month, foreign exchange and seasonal fluctuations resulting
from business and collection-payment cycles as well as to changes in foreign exchange conversion rates.
The following table summarizes our total available liquidity:
As of December 31,
(€ million) 2014 2013 2012
Cash, cash equivalent and current securities(1) 23,050 19,702 17,922
Undrawn committed credit lines(2) 3,171 3,043 2,935
Total available liquidity(3) 26,221 22,745 20,857
(1) Current securities comprise short term or marketable securities which represent temporary investments but which do not satisfy all the
requirements to be classified as cash equivalents as they may not be able to be readily converted into cash or they are subject to significant
risk of change in value (even if they are short-term in nature or marketable).
(2) Excludes the undrawn €0.9 billion medium/long-term dedicated credit lines available to fund scheduled investments as of December 31, 2014
(€1.8 billion was undrawn as of December 31, 2013 and €1.3 billion was undrawn as of December 31, 2012).
(3) The majority of our liquidity is available to our treasury operations in Europe, U.S. (subject to the previously discussed restrictions on FCA US
distributions) and Brazil; however, liquidity is also available to certain subsidiaries which operate in other areas. Cash held in such countries
may be subject to restrictions on transfer depending on the foreign jurisdictions in which these subsidiaries operate. Based on our review of
such transfer restrictions in the countries in which we operate and maintain material cash balances, we do not believe such transfer restrictions
have an adverse impact on the Group’s ability to meet its liquidity requirements at the dates represented above.
Our liquidity is principally denominated in U.S. Dollar and in Euro. Out of the total €23.0 billion of cash, cash
equivalents and current securities available at December 31, 2014 (€19.7 billion at December 31, 2013, €17.9 billion
at December 31, 2012), €10.6 billion, or 46.0 percent were denominated in U.S. Dollar (€8.3 billion, or 42.1 percent,
at December 31, 2013) and €6.2 billion, or 27.0 percent, were denominated in Euro (€6.1 billion, or 31.0 percent,
at December 31, 2013). Liquidity available in Brazil and denominated in Brazilian Reals accounted for €1.6 billion or
7.0 percent at December 31, 2014 (€1.5 billion, or 7.6 percent, at December 31, 2013), with the remainder being
distributed in various countries and denominated in the relevant local currencies.
The increase in total available liquidity from December 31, 2013 to December 31, 2014 primarily reflects a €3,385
million increase in cash and cash equivalents. Refer to Cash Flows, below for additional information regarding change
in cash and cash equivalents.
Acquisition of the Remaining Equity Interest in FCA US
On January 1, 2014 we announced an agreement with the VEBA Trust, under which our wholly owned subsidiary,
FCA North America Holdings LLC (“FCA NA”, formerly known as Fiat North America LLC), would acquire the
remaining 41.5 percent ownership interest in FCA US held by the VEBA Trust for total consideration of U.S.$3,650
million (equivalent to €2,691 million). The transaction closed on January 21, 2014. The consideration for the
acquisition consisted of:
a special distribution paid by FCA US to its members on January 21, 2014 of U.S.$1,900 million (equivalent to
€1,404 million) wherein FCA NA directed its portion of the special distribution to the VEBA Trust as part of the
purchase consideration which served to fund a portion of the transaction; and
a cash payment by FCA NA to the VEBA Trust of U.S.$1,750 million (equivalent to €1.3 billion) on January 21,
2014.
The distribution from FCA US was funded from FCA US’s available cash on hand. The payment by FCA NA was
funded by Fiat’s available cash on hand.