Chrysler 2014 Annual Report Download - page 58
Download and view the complete annual report
Please find page 58 of the 2014 Chrysler annual report below. You can navigate through the pages in the report by either clicking on the pages listed below, or by using the keyword search tool below to find specific information within the annual report.-
 1
1 -
2
-
3
-
4
-
5
-
6
-
7
-
8
-
9
-
10
-
11
-
12
-
13
-
14
-
15
-
16
-
17
-
18
-
19
-
20
-
21
-
22
-
23
-
24
-
25
-
26
-
27
-
28
-
29
-
30
-
31
-
32
-
33
-
34
-
35
-
36
-
37
-
38
-
39
-
40
-
41
-
42
-
43
-
44
-
45
-
46
-
47
-
 48
48 -
 49
49 -
 50
50 -
 51
51 -
 52
52 -
 53
53 -
 54
54 -
 55
55 -
 56
56 -
 57
57 -
 58
58 -
 59
59 -
 60
60 -
 61
61 -
 62
62 -
 63
63 -
 64
64 -
 65
65 -
 66
66 -
 67
67 -
 68
68 -
69
-
70
-
71
-
72
-
73
-
74
-
75
-
76
-
77
-
78
-
79
-
80
-
81
-
82
-
83
-
84
-
85
-
86
-
87
-
88
-
89
-
90
-
91
-
92
-
93
-
94
-
95
-
96
-
97
-
98
-
99
-
100
-
101
-
102
-
103
-
104
-
105
-
106
-
107
-
108
-
109
-
110
-
111
-
112
-
113
-
114
-
115
-
116
-
117
-
118
-
119
-
120
-
121
-
122
-
123
-
124
-
125
-
126
-
127
-
128
-
129
-
130
-
131
-
132
-
133
-
134
-
135
-
136
-
137
-
138
-
139
-
140
-
141
-
142
-
143
-
144
-
145
-
146
-
147
-
148
-
149
-
150
-
151
-
152
-
153
-
154
-
155
-
156
-
157
-
158
-
159
-
160
-
161
-
162
-
163
-
164
-
165
-
166
-
167
-
168
-
169
-
170
-
171
-
172
-
173
-
174
-
175
-
176
-
177
-
178
-
179
-
180
-
181
-
182
-
183
-
184
-
185
-
186
-
187
-
188
-
189
-
190
-
191
-
192
-
193
-
194
-
195
-
196
-
197
-
198
-
199
-
200
-
201
-
202
-
203
-
204
-
205
-
206
-
207
-
208
-
209
-
210
-
211
-
212
-
213
-
214
-
215
-
216
-
217
-
218
-
219
-
220
-
221
-
222
-
223
-
224
-
225
-
226
-
227
-
228
-
229
-
230
-
231
-
232
-
233
-
234
-
235
-
236
-
237
-
238
-
239
-
240
-
241
-
242
-
243
-
244
-
245
-
246
-
247
-
248
-
249
-
250
-
251
-
252
-
253
-
254
-
255
-
256
-
257
-
258
-
259
-
260
-
261
-
262
-
263
-
264
-
265
-
266
-
267
-
268
-
269
-
270
-
271
-
272
-
273
-
274
-
275
-
276
-
277
-
278
-
279
-
280
-
281
-
282
-
283
-
284
-
285
-
286
-
287
-
288
-
289
-
290
-
291
-
292
-
293
-
294
-
295
-
296
-
297
-
298
-
299
-
300
-
301
-
302
-
303
 |
 |

56 2014 | ANNUAL REPORT
Operating Results
Operating Results
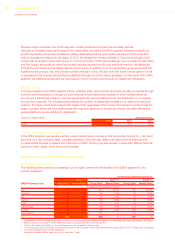
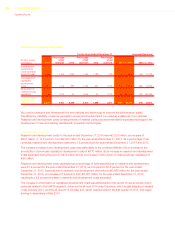
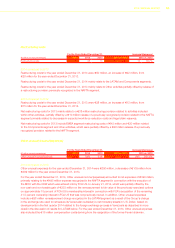
Results of Operations
The following is a discussion of the results of operations for the year ended December 31, 2014 as compared to
the year ended December 31, 2013 and for the year ended December 31, 2013 as compared to the year ended
December 31, 2012. The discussion of certain line items (cost of sales, selling, general and administrative costs and
research and development costs) includes a presentation of such line items as a percentage of net revenues for the
respective periods presented, to facilitate the year-on-year comparisons.
For the Years Ended December 31,
(€ million) 2014 2013 2012
Net revenues 96,090 86,624 83,765
Cost of sales 83,146 74,326 71,473
Selling, general and administrative costs 7,084 6,702 6,775
Research and development costs 2,537 2,236 1,858
Other income/(expenses) 197 77 (68)
Result from investments 131 84 87
Gains/(losses) on the disposal of investments 12 8 (91)
Restructuring costs 50 28 15
Other unusual income/(expenses) (390) (499) (138)
EBIT 3,223 3,002 3,434
Net financial expenses (2,047) (1,987) (1,910)
Profit before taxes 1,176 1,015 1,524
Tax expense/(income) 544 (936) 628
Net profit 632 1,951 896
Net profit attributable to:
Owners of the parent 568 904 44
Non-controlling interests 64 1,047 852
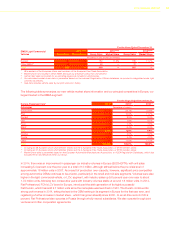
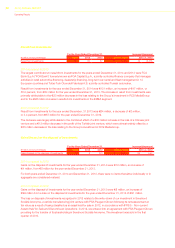
Net revenues
For the Years Ended December 31, Increase/(decrease)
(€ million, except percentages) 2014 2013 2012 2014 vs. 2013 2013 vs. 2012
Net revenues 96,090 86,624 83,765 9,466 10.9% 2,859 3.4%
2014 compared to 2013
Net revenues for the year ended December 31, 2014 were €96.1 billion, an increase of €9.5 billion, or 10.9 percent
(11.9 percent on a constant currency basis), from €86.6 billion for the year ended December 31, 2013.
The increase in net revenues was primarily attributable to (i) a €6.7 billion increase in NAFTA net revenues, related to
an increase in shipments and improved vehicle and distribution channel mix, (ii) a €1.6 billion increase in APAC net
revenues attributable to an increase in shipments and improved vehicle mix, (iii) a €1.1 billion increase in Maserati net
revenues primarily attributable to an increase in shipments, (iv) a €0.7 billion increase in EMEA net revenues mainly
attributable to an increase in shipments and improved mix, and (v) an increase of €0.5 billion in Components net
revenues, which were partially offset by (vi) a decrease of €1.3 billion in LATAM net revenues. The decrease in LATAM
net revenues was attributable to the combined effect of lower vehicle shipments and unfavorable foreign currency
translation effect related to the weakening of the Brazilian Real against the Euro, only partially offset by positive pricing
and vehicle mix.