Chrysler 2014 Annual Report Download - page 71
Download and view the complete annual report
Please find page 71 of the 2014 Chrysler annual report below. You can navigate through the pages in the report by either clicking on the pages listed below, or by using the keyword search tool below to find specific information within the annual report.-
 1
1 -
2
-
3
-
4
-
5
-
6
-
7
-
8
-
9
-
10
-
11
-
12
-
13
-
14
-
15
-
16
-
17
-
18
-
19
-
20
-
21
-
22
-
23
-
24
-
25
-
26
-
27
-
28
-
29
-
30
-
31
-
32
-
33
-
34
-
35
-
36
-
37
-
38
-
39
-
40
-
41
-
42
-
43
-
44
-
45
-
46
-
47
-
48
-
49
-
50
-
51
-
52
-
53
-
54
-
55
-
56
-
57
-
58
-
59
-
60
-
 61
61 -
 62
62 -
 63
63 -
 64
64 -
 65
65 -
 66
66 -
 67
67 -
 68
68 -
 69
69 -
 70
70 -
 71
71 -
 72
72 -
 73
73 -
 74
74 -
 75
75 -
 76
76 -
 77
77 -
 78
78 -
 79
79 -
 80
80 -
 81
81 -
82
-
83
-
84
-
85
-
86
-
87
-
88
-
89
-
90
-
91
-
92
-
93
-
94
-
95
-
96
-
97
-
98
-
99
-
100
-
101
-
102
-
103
-
104
-
105
-
106
-
107
-
108
-
109
-
110
-
111
-
112
-
113
-
114
-
115
-
116
-
117
-
118
-
119
-
120
-
121
-
122
-
123
-
124
-
125
-
126
-
127
-
128
-
129
-
130
-
131
-
132
-
133
-
134
-
135
-
136
-
137
-
138
-
139
-
140
-
141
-
142
-
143
-
144
-
145
-
146
-
147
-
148
-
149
-
150
-
151
-
152
-
153
-
154
-
155
-
156
-
157
-
158
-
159
-
160
-
161
-
162
-
163
-
164
-
165
-
166
-
167
-
168
-
169
-
170
-
171
-
172
-
173
-
174
-
175
-
176
-
177
-
178
-
179
-
180
-
181
-
182
-
183
-
184
-
185
-
186
-
187
-
188
-
189
-
190
-
191
-
192
-
193
-
194
-
195
-
196
-
197
-
198
-
199
-
200
-
201
-
202
-
203
-
204
-
205
-
206
-
207
-
208
-
209
-
210
-
211
-
212
-
213
-
214
-
215
-
216
-
217
-
218
-
219
-
220
-
221
-
222
-
223
-
224
-
225
-
226
-
227
-
228
-
229
-
230
-
231
-
232
-
233
-
234
-
235
-
236
-
237
-
238
-
239
-
240
-
241
-
242
-
243
-
244
-
245
-
246
-
247
-
248
-
249
-
250
-
251
-
252
-
253
-
254
-
255
-
256
-
257
-
258
-
259
-
260
-
261
-
262
-
263
-
264
-
265
-
266
-
267
-
268
-
269
-
270
-
271
-
272
-
273
-
274
-
275
-
276
-
277
-
278
-
279
-
280
-
281
-
282
-
283
-
284
-
285
-
286
-
287
-
288
-
289
-
290
-
291
-
292
-
293
-
294
-
295
-
296
-
297
-
298
-
299
-
300
-
301
-
302
-
303
 |
 |

2014 | ANNUAL REPORT 69
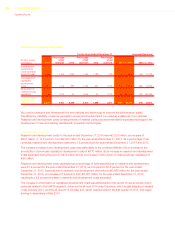
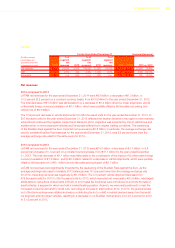
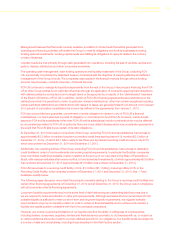
LATAM
For the Years Ended December 31, Increase/(decrease)
(€ million, except
percentages and
shipments which are
in thousands of units) 2014
% of
segment
net
revenues 2013
% of
segment
net
revenues 2012
% of
segment
net
revenues 2014 vs. 2013 2013 vs. 2012
Net revenues 8,629 100.0% 9,973 100.0% 11,062 100.0% (1,344) (13.5)% (1,089) (9.8)%
EBIT 177 2.1% 492 4.9% 1,025 9.3% (315) (64.0)% (533) (52.0)%
Shipments 827 n.m 950 n.m. 979 n.m. (123) (12.9)% (29) (3.0)%
Net revenues
2014 compared to 2013
LATAM net revenues for the year ended December 31, 2014 were €8.6 billion, a decrease of €1.3 billion, or
13.5 percent (6.9 percent on a constant currency basis), from €10.0 billion for the year ended December 31, 2013.
The total decrease of €1.3 billion was attributable to (i) a decrease of €1.2 billion driven by lower shipments, and (ii)
unfavorable foreign currency translation of €0.7 billion, which were partially offset by (iii) favorable net pricing and
vehicle mix of €0.6 billion.
The 12.9 percent decrease in vehicle shipments from 950 thousand units for the year ended December 31, 2013, to
827 thousand units for the year ended December 31, 2014 reflected the weaker demand in the region’s main markets,
where Brazil continued the negative market trend started in 2012, Argentina was impacted by import restrictions and
additional tax on more expensive vehicles and Venezuela suffered from weaker trading conditions. The weakening
of the Brazilian Real against the Euro impacted net revenues by €0.6 billion, in particular, the average exchange rate
used to translate Brazilian Real balances for the year ended December 31, 2014, was 8.9 percent lower than the
average exchange rate used for the same period in 2013.
2013 compared to 2012
LATAM net revenues for the year ended December 31, 2013 were €10.0 billion, a decrease of €1.1 billion, or 9.8
percent (an increase of 0.7 percent on a constant currency basis), from €11.1 billion for the year ended December
31, 2012. The total decrease of €1.1 billion was attributable to the combination of the impact of (i) unfavorable foreign
currency translation of €1.2 billion, and (ii) €0.3 billion related to a decrease in vehicle shipments, which were partially
offset by (iii) favorable mix of €0.1 billion and (iv) favorable pricing impact of €0.1 billion.
LATAM net revenues were significantly impacted by the weakening of the Brazilian Real against the Euro, as the
average exchange rate used to translate 2013 balances was 14.3 percent lower than the average exchange rate
for 2012, impacting net revenues negatively by €1.2 billion. The 3.0 percent vehicle shipment decrease from
979 thousand units for 2012 to 950 thousand units for 2013, which impacted net revenues by €0.3 billion, was largely
attributable to reductions of shipments in Brazil. In 2012 sales tax incentives were introduced to promote the sale of
small vehicles, a segment in which we hold a market leading position. As such, we were well positioned to meet the
increased consumer demand for small cars, recording an increase in shipments in 2012. In 2013, the gradual phase
out of the tax incentives was initiated and was a contributing factor to a shift in market demand away from the small
car segment and into larger vehicles, resulting in a decrease in our Brazilian market share, from 23.3 percent in 2012
to 21.5 percent in 2013.