Chrysler 2014 Annual Report Download - page 73
Download and view the complete annual report
Please find page 73 of the 2014 Chrysler annual report below. You can navigate through the pages in the report by either clicking on the pages listed below, or by using the keyword search tool below to find specific information within the annual report.-
 1
1 -
2
-
3
-
4
-
5
-
6
-
7
-
8
-
9
-
10
-
11
-
12
-
13
-
14
-
15
-
16
-
17
-
18
-
19
-
20
-
21
-
22
-
23
-
24
-
25
-
26
-
27
-
28
-
29
-
30
-
31
-
32
-
33
-
34
-
35
-
36
-
37
-
38
-
39
-
40
-
41
-
42
-
43
-
44
-
45
-
46
-
47
-
48
-
49
-
50
-
51
-
52
-
53
-
54
-
55
-
56
-
57
-
58
-
59
-
60
-
61
-
62
-
 63
63 -
 64
64 -
 65
65 -
 66
66 -
 67
67 -
 68
68 -
 69
69 -
 70
70 -
 71
71 -
 72
72 -
 73
73 -
 74
74 -
 75
75 -
 76
76 -
 77
77 -
 78
78 -
 79
79 -
 80
80 -
 81
81 -
 82
82 -
 83
83 -
84
-
85
-
86
-
87
-
88
-
89
-
90
-
91
-
92
-
93
-
94
-
95
-
96
-
97
-
98
-
99
-
100
-
101
-
102
-
103
-
104
-
105
-
106
-
107
-
108
-
109
-
110
-
111
-
112
-
113
-
114
-
115
-
116
-
117
-
118
-
119
-
120
-
121
-
122
-
123
-
124
-
125
-
126
-
127
-
128
-
129
-
130
-
131
-
132
-
133
-
134
-
135
-
136
-
137
-
138
-
139
-
140
-
141
-
142
-
143
-
144
-
145
-
146
-
147
-
148
-
149
-
150
-
151
-
152
-
153
-
154
-
155
-
156
-
157
-
158
-
159
-
160
-
161
-
162
-
163
-
164
-
165
-
166
-
167
-
168
-
169
-
170
-
171
-
172
-
173
-
174
-
175
-
176
-
177
-
178
-
179
-
180
-
181
-
182
-
183
-
184
-
185
-
186
-
187
-
188
-
189
-
190
-
191
-
192
-
193
-
194
-
195
-
196
-
197
-
198
-
199
-
200
-
201
-
202
-
203
-
204
-
205
-
206
-
207
-
208
-
209
-
210
-
211
-
212
-
213
-
214
-
215
-
216
-
217
-
218
-
219
-
220
-
221
-
222
-
223
-
224
-
225
-
226
-
227
-
228
-
229
-
230
-
231
-
232
-
233
-
234
-
235
-
236
-
237
-
238
-
239
-
240
-
241
-
242
-
243
-
244
-
245
-
246
-
247
-
248
-
249
-
250
-
251
-
252
-
253
-
254
-
255
-
256
-
257
-
258
-
259
-
260
-
261
-
262
-
263
-
264
-
265
-
266
-
267
-
268
-
269
-
270
-
271
-
272
-
273
-
274
-
275
-
276
-
277
-
278
-
279
-
280
-
281
-
282
-
283
-
284
-
285
-
286
-
287
-
288
-
289
-
290
-
291
-
292
-
293
-
294
-
295
-
296
-
297
-
298
-
299
-
300
-
301
-
302
-
303
 |
 |
2014 | ANNUAL REPORT 71
On February 10, 2015, the Venezuelan government introduced a new market-based exchange system, referred to
as Marginal Currency System, or the SIMADI rate, with certain specified limitations on its usage by individuals and
legal entities. On February 12, 2015, the SIMADI rate began trading at 170 VEF to U.S. Dollar and is expected to be
used by individuals and legal entities in the private sector. We are currently evaluating our utilization of the SIMADI rate
since this new exchange system is limited by certain government mandated restrictions. In addition, the Venezuelan
government announced that the SICAD I and SICAD II auction-based exchange systems would be merged into a
single exchange system, with a rate starting at 12.0 VEF to U.S. Dollar. We continue to monitor the appropriate rate
to be used for remeasuring our net monetary assets. Additionally, we will continue to monitor the currency exchange
regulations and other factors to assess whether our ability to control and benefit from our Venezuelan operations has
been adversely affected.
2013 compared to 2012
LATAM EBIT for the year ended December 31, 2013 was €492 million, a decrease of €533 million, or 52.0 percent
(44.5 percent on a constant currency basis), from €1,025 million for December 31, 2012.
The decrease in LATAM EBIT was primarily attributable to the combination of (i) an increase in industrial costs of
€257 million related to increased labor costs and price increases for certain purchases, as the weakening of the
Brazilian Real affected the prices of foreign currency denominated purchases, (ii) unfavorable volume/mix impact
of €111 million, driven by the combination of the previously described 3.0 percent decrease in shipments, and an
increase in the proportion of vehicles produced in Argentina, for which we have higher manufacturing and logistic
costs than in Brazil, (iii) a €96 million increase in other unusual expenses, (iv) the impact of unfavorable foreign
currency translation of €77 million related to the previously described weakening of the Brazilian Real against the Euro
and (v) an increase in selling, general and administrative costs of €37 million mainly due to new advertising campaigns
in Brazil, which were partially offset by favorable pricing impact of €64 million, supported by new product launches.
In particular, the most significant components of other unusual expenses included €75 million attributable to the
streamlining of architectures and models associated to the refocused product strategy and €43 million relating to the
loss recognized on translation of certain monetary liabilities from VEF into U.S. Dollar, on the devaluation of the official
exchange rate of the VEF. For further details see Notes 8 and 21 to the Consolidated financial statements included
elsewhere in this report.
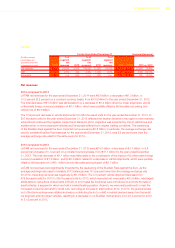
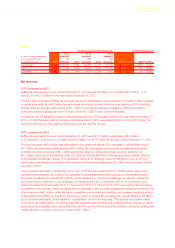
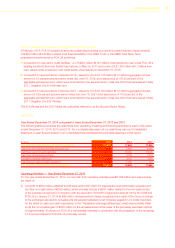
APAC
For the Years Ended December 31, Increase/(decrease)
(€ million, except percentages
and shipments which are in
thousands of units) 2014
% of
segment
net
revenues 2013
% of
segment
net
revenues 2012
% of
segment
net
revenues 2014 vs. 2013 2013 vs. 2012
Net revenues 6,259 100.0% 4,668 100.0% 3,173 100.0% 1,591 34.1% 1,495 47.1%
EBIT 537 8.6% 335 7.2% 274 8.6% 202 60.3% 61 22.3%
Shipments 220 n.m 163 n.m. 103 n.m. 57 35.0% 60 58.3%
Net revenues
2014 compared to 2013
APAC net revenues for the year ended December 31, 2014 were €6.3 billion, an increase of €1.6 billion,
or 34.1 percent (34.6 percent on a constant currency basis), from €4.7 billion for the year ended December 31, 2013.
The total increase of €1.6 billion was primarily attributable to an increase in shipments and improved vehicle mix.
The 35.0 percent increase in shipments from 163 thousand units for the year ended December 31, 2013, to
220 thousand units for the year ended December 31, 2014, was largely supported by shipments to China and
Australia, and in particular, driven by Jeep Grand Cherokee, Dodge Journey and the newly-launched Jeep Cherokee.