Chrysler 2014 Annual Report Download - page 239
Download and view the complete annual report
Please find page 239 of the 2014 Chrysler annual report below. You can navigate through the pages in the report by either clicking on the pages listed below, or by using the keyword search tool below to find specific information within the annual report.-
 1
1 -
2
-
3
-
4
-
5
-
6
-
7
-
8
-
9
-
10
-
11
-
12
-
13
-
14
-
15
-
16
-
17
-
18
-
19
-
20
-
21
-
22
-
23
-
24
-
25
-
26
-
27
-
28
-
29
-
30
-
31
-
32
-
33
-
34
-
35
-
36
-
37
-
38
-
39
-
40
-
41
-
42
-
43
-
44
-
45
-
46
-
47
-
48
-
49
-
50
-
51
-
52
-
53
-
54
-
55
-
56
-
57
-
58
-
59
-
60
-
61
-
62
-
63
-
64
-
65
-
66
-
67
-
68
-
69
-
70
-
71
-
72
-
73
-
74
-
75
-
76
-
77
-
78
-
79
-
80
-
81
-
82
-
83
-
84
-
85
-
86
-
87
-
88
-
89
-
90
-
91
-
92
-
93
-
94
-
95
-
96
-
97
-
98
-
99
-
100
-
101
-
102
-
103
-
104
-
105
-
106
-
107
-
108
-
109
-
110
-
111
-
112
-
113
-
114
-
115
-
116
-
117
-
118
-
119
-
120
-
121
-
122
-
123
-
124
-
125
-
126
-
127
-
128
-
129
-
130
-
131
-
132
-
133
-
134
-
135
-
136
-
137
-
138
-
139
-
140
-
141
-
142
-
143
-
144
-
145
-
146
-
147
-
148
-
149
-
150
-
151
-
152
-
153
-
154
-
155
-
156
-
157
-
158
-
159
-
160
-
161
-
162
-
163
-
164
-
165
-
166
-
167
-
168
-
169
-
170
-
171
-
172
-
173
-
174
-
175
-
176
-
177
-
178
-
179
-
180
-
181
-
182
-
183
-
184
-
185
-
186
-
187
-
188
-
189
-
190
-
191
-
192
-
193
-
194
-
195
-
196
-
197
-
198
-
199
-
200
-
201
-
202
-
203
-
204
-
205
-
206
-
207
-
208
-
209
-
210
-
211
-
212
-
213
-
214
-
215
-
216
-
217
-
218
-
219
-
220
-
221
-
222
-
223
-
224
-
225
-
226
-
227
-
228
-
 229
229 -
 230
230 -
 231
231 -
 232
232 -
 233
233 -
 234
234 -
 235
235 -
 236
236 -
 237
237 -
 238
238 -
 239
239 -
 240
240 -
 241
241 -
 242
242 -
 243
243 -
 244
244 -
 245
245 -
 246
246 -
 247
247 -
 248
248 -
 249
249 -
250
-
251
-
252
-
253
-
254
-
255
-
256
-
257
-
258
-
259
-
260
-
261
-
262
-
263
-
264
-
265
-
266
-
267
-
268
-
269
-
270
-
271
-
272
-
273
-
274
-
275
-
276
-
277
-
278
-
279
-
280
-
281
-
282
-
283
-
284
-
285
-
286
-
287
-
288
-
289
-
290
-
291
-
292
-
293
-
294
-
295
-
296
-
297
-
298
-
299
-
300
-
301
-
302
-
303
 |
 |

2014 | ANNUAL REPORT 237
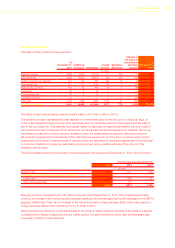
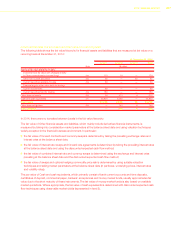
Assets and liabilities that are measured at fair value on a recurring basis
The following table shows the fair value hierarchy for financial assets and liabilities that are measured at fair value on a
recurring basis at December 31, 2014:
At December 31, 2014
Level 1 Level 2 Level 3 Total
Note (€ million)
Assets at fair value available-for-sale:
Investments at fair value with changes directly
in Other comprehensive income/(loss) (16) 110 14 — 124
Other non-current securities (16) 45 — 22 67
Current securities available-for-sale (19) 30 — — 30
Financial assets at fair value held-for-trading:
Current investments 36 — — 36
Current securities held for trading (19) 180 — — 180
Other financial assets (20) 38 473 4 515
Cash and cash equivalents (21) 20,804 2,036 — 22,840
Total Assets 21,243 2,523 26 23,792
Other financial liabilities (20) — 740 8 748
Total Liabilities — 740 8 748
In 2014, there were no transfers between Levels in the fair value hierarchy.
The fair value of Other financial assets and liabilities, which mainly include derivatives financial instruments, is
measured by taking into consideration market parameters at the balance sheet date and using valuation techniques
widely accepted in the financial business environment. In particular:
the fair value of forward contracts and currency swaps is determined by taking the prevailing exchange rates and
interest rates at the balance sheet date;
the fair value of interest rate swaps and forward rate agreements is determined by taking the prevailing interest rates
at the balance sheet date and using the discounted expected cash flow method;
the fair value of combined interest rate and currency swaps is determined using the exchange and interest rates
prevailing at the balance sheet date and the discounted expected cash flow method;
the fair value of swaps and options hedging commodity price risk is determined by using suitable valuation
techniques and taking market parameters at the balance sheet date (in particular, underlying prices, interest rates
and volatility rates).
The par value of Cash and cash equivalents, which primarily consist of bank current accounts and time deposits,
certificates of deposit, commercial paper, bankers’ acceptances and money market funds, usually approximates fair
value due to the short maturity of these instruments. The fair value of money market funds is also based on available
market quotations. Where appropriate, the fair value of cash equivalents is determined with discounted expected cash
flow techniques using observable market yields (represented in level 2).