Chrysler 2014 Annual Report Download - page 64
Download and view the complete annual report
Please find page 64 of the 2014 Chrysler annual report below. You can navigate through the pages in the report by either clicking on the pages listed below, or by using the keyword search tool below to find specific information within the annual report.-
 1
1 -
2
-
3
-
4
-
5
-
6
-
7
-
8
-
9
-
10
-
11
-
12
-
13
-
14
-
15
-
16
-
17
-
18
-
19
-
20
-
21
-
22
-
23
-
24
-
25
-
26
-
27
-
28
-
29
-
30
-
31
-
32
-
33
-
34
-
35
-
36
-
37
-
38
-
39
-
40
-
41
-
42
-
43
-
44
-
45
-
46
-
47
-
48
-
49
-
50
-
51
-
52
-
53
-
 54
54 -
 55
55 -
 56
56 -
 57
57 -
 58
58 -
 59
59 -
 60
60 -
 61
61 -
 62
62 -
 63
63 -
 64
64 -
 65
65 -
 66
66 -
 67
67 -
 68
68 -
 69
69 -
 70
70 -
 71
71 -
 72
72 -
 73
73 -
 74
74 -
75
-
76
-
77
-
78
-
79
-
80
-
81
-
82
-
83
-
84
-
85
-
86
-
87
-
88
-
89
-
90
-
91
-
92
-
93
-
94
-
95
-
96
-
97
-
98
-
99
-
100
-
101
-
102
-
103
-
104
-
105
-
106
-
107
-
108
-
109
-
110
-
111
-
112
-
113
-
114
-
115
-
116
-
117
-
118
-
119
-
120
-
121
-
122
-
123
-
124
-
125
-
126
-
127
-
128
-
129
-
130
-
131
-
132
-
133
-
134
-
135
-
136
-
137
-
138
-
139
-
140
-
141
-
142
-
143
-
144
-
145
-
146
-
147
-
148
-
149
-
150
-
151
-
152
-
153
-
154
-
155
-
156
-
157
-
158
-
159
-
160
-
161
-
162
-
163
-
164
-
165
-
166
-
167
-
168
-
169
-
170
-
171
-
172
-
173
-
174
-
175
-
176
-
177
-
178
-
179
-
180
-
181
-
182
-
183
-
184
-
185
-
186
-
187
-
188
-
189
-
190
-
191
-
192
-
193
-
194
-
195
-
196
-
197
-
198
-
199
-
200
-
201
-
202
-
203
-
204
-
205
-
206
-
207
-
208
-
209
-
210
-
211
-
212
-
213
-
214
-
215
-
216
-
217
-
218
-
219
-
220
-
221
-
222
-
223
-
224
-
225
-
226
-
227
-
228
-
229
-
230
-
231
-
232
-
233
-
234
-
235
-
236
-
237
-
238
-
239
-
240
-
241
-
242
-
243
-
244
-
245
-
246
-
247
-
248
-
249
-
250
-
251
-
252
-
253
-
254
-
255
-
256
-
257
-
258
-
259
-
260
-
261
-
262
-
263
-
264
-
265
-
266
-
267
-
268
-
269
-
270
-
271
-
272
-
273
-
274
-
275
-
276
-
277
-
278
-
279
-
280
-
281
-
282
-
283
-
284
-
285
-
286
-
287
-
288
-
289
-
290
-
291
-
292
-
293
-
294
-
295
-
296
-
297
-
298
-
299
-
300
-
301
-
302
-
303
 |
 |

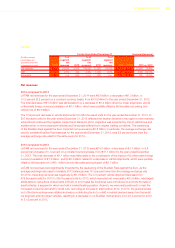
62 2014 | ANNUAL REPORT
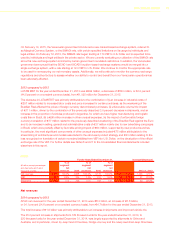
Operating Results
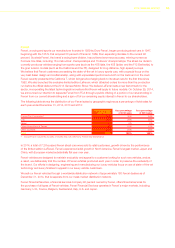
Result from investments
For the Years Ended December 31, Increase/(decrease)
(€ million, except percentages) 2014 2013 2012 2014 vs. 2013 2013 vs. 2012
Result from investments 131 84 87 47 56.0% (3) (3.4)%
2014 compared to 2013
The largest contributors to result from investments for the years ended December 31, 2014 and 2013 were FCA
Bank S.p.A (“FCA Bank”) formerly known as FGA Capital S.p.A., a jointly-controlled finance company that manages
activities in retail automotive financing, dealership financing, long-term car rental and fleet management in 14
European countries and Tofas-Turk Otomobil Fabrikasi A.S. a jointly-controlled Turkish automaker.
Result from investments for the year ended December 31, 2014 was €131 million, an increase of €47 million, or
56.0 percent, from €84 million for the year ended December 31, 2013. The increase in result from investments was
primarily attributable to the €20 million decrease in the loss relating to the Group’s investment in RCS MediaGroup
and to the €26 million increase in results from investments in the EMEA segment.
2013 compared to 2012
Result from investments for the year ended December, 31 2013 was €84 million, a decrease of €3 million,
or 3.4 percent, from €87 million for the year ended December 31, 2012.
The decrease was largely attributable to the combined effect of a €23 million increase in the loss of a Chinese joint
venture and a €12 million decrease in the profit of the Turkish joint venture, which were almost entirely offset by a
€35 million decrease in the loss relating to the Group’s investment in RCS MediaGroup.
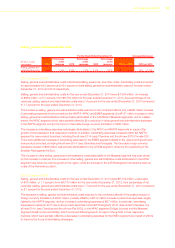
Gains/(losses) on the disposal of investments
For the Years Ended December 31, Increase/(decrease)
(€ million, except percentages) 2014 2013 2012 2014 vs. 2013 2013 vs. 2012
Gains/(losses) on the disposal of investments 12 8 (91) 4 50.0% 99 n.m.
2014 compared to 2013
Gains on the disposal of investments for the year ended December 31, 2014 were €12 million, an increase of
€4 million, from €8 million for the year ended December 31, 2013.
For both years ended December 31, 2014 and December 31, 2013, there were no items that either individually or in
aggregate are considered material.
2013 compared to 2012
Gains on the disposal of investments for the year ended December 31, 2013 were €8 million, an increase of
€99 million from a loss on the disposal of investments for the year ended December 31, 2012 of €91 million.
The loss on disposal of investments recognized in 2012 relates to the write-down of our investment in Sevelnord
Société Anonyme, a vehicle manufacturing joint venture with PSA Peugeot Citroen following its remeasurement at
fair value as a result of being classified as an asset held for sale in 2012, in accordance with IFRS 5 - Non-current
Assets Held for Sale and Discontinued Operations. In 2012, we entered into an agreement with PSA Peugeot Citroen
providing for the transfer of its shareholding in Sevelnord Société Anonyme. The investment was sold in the first
quarter of 2013.