Chrysler 2014 Annual Report Download - page 133
Download and view the complete annual report
Please find page 133 of the 2014 Chrysler annual report below. You can navigate through the pages in the report by either clicking on the pages listed below, or by using the keyword search tool below to find specific information within the annual report.-
 1
1 -
2
-
3
-
4
-
5
-
6
-
7
-
8
-
9
-
10
-
11
-
12
-
13
-
14
-
15
-
16
-
17
-
18
-
19
-
20
-
21
-
22
-
23
-
24
-
25
-
26
-
27
-
28
-
29
-
30
-
31
-
32
-
33
-
34
-
35
-
36
-
37
-
38
-
39
-
40
-
41
-
42
-
43
-
44
-
45
-
46
-
47
-
48
-
49
-
50
-
51
-
52
-
53
-
54
-
55
-
56
-
57
-
58
-
59
-
60
-
61
-
62
-
63
-
64
-
65
-
66
-
67
-
68
-
69
-
70
-
71
-
72
-
73
-
74
-
75
-
76
-
77
-
78
-
79
-
80
-
81
-
82
-
83
-
84
-
85
-
86
-
87
-
88
-
89
-
90
-
91
-
92
-
93
-
94
-
95
-
96
-
97
-
98
-
99
-
100
-
101
-
102
-
103
-
104
-
105
-
106
-
107
-
108
-
109
-
110
-
111
-
112
-
113
-
114
-
115
-
116
-
117
-
118
-
119
-
120
-
121
-
122
-
 123
123 -
 124
124 -
 125
125 -
 126
126 -
 127
127 -
 128
128 -
 129
129 -
 130
130 -
 131
131 -
 132
132 -
 133
133 -
 134
134 -
 135
135 -
 136
136 -
 137
137 -
 138
138 -
 139
139 -
 140
140 -
 141
141 -
 142
142 -
 143
143 -
144
-
145
-
146
-
147
-
148
-
149
-
150
-
151
-
152
-
153
-
154
-
155
-
156
-
157
-
158
-
159
-
160
-
161
-
162
-
163
-
164
-
165
-
166
-
167
-
168
-
169
-
170
-
171
-
172
-
173
-
174
-
175
-
176
-
177
-
178
-
179
-
180
-
181
-
182
-
183
-
184
-
185
-
186
-
187
-
188
-
189
-
190
-
191
-
192
-
193
-
194
-
195
-
196
-
197
-
198
-
199
-
200
-
201
-
202
-
203
-
204
-
205
-
206
-
207
-
208
-
209
-
210
-
211
-
212
-
213
-
214
-
215
-
216
-
217
-
218
-
219
-
220
-
221
-
222
-
223
-
224
-
225
-
226
-
227
-
228
-
229
-
230
-
231
-
232
-
233
-
234
-
235
-
236
-
237
-
238
-
239
-
240
-
241
-
242
-
243
-
244
-
245
-
246
-
247
-
248
-
249
-
250
-
251
-
252
-
253
-
254
-
255
-
256
-
257
-
258
-
259
-
260
-
261
-
262
-
263
-
264
-
265
-
266
-
267
-
268
-
269
-
270
-
271
-
272
-
273
-
274
-
275
-
276
-
277
-
278
-
279
-
280
-
281
-
282
-
283
-
284
-
285
-
286
-
287
-
288
-
289
-
290
-
291
-
292
-
293
-
294
-
295
-
296
-
297
-
298
-
299
-
300
-
301
-
302
-
303
 |
 |
2014 | ANNUAL REPORT 131
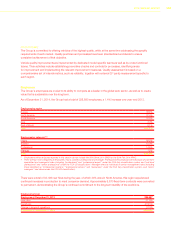
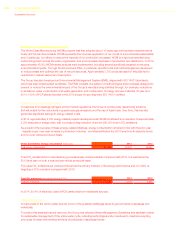
In 2014, the level of water reuse in the manufacturing cycle at FCA plants worldwide was 99.3%, representing a total
of about 3.3 billion m3 in water savings.
As a result, total water consumption (withdrawal) was reduced by 1.1% versus 2013 (generating savings of
approximately €2.4 million) and 27.9% versus 2010. For 2020, FCA is targeting a 40% reduction in water consumed
per vehicle produced compared with 2010.
Water withdrawal (thousands of m3)2014 2013 2012
Total water withdrawal 24,653 24,936 25,874
Waste Management
To reduce the consumption of raw materials and related environmental impacts, FCA has implemented procedures to
ensure maximum recovery and reuse of materials and minimum waste. What cannot be reused is recycled. If neither
reuse nor recovery is possible, waste is disposed of using the method having the least environmental impact, with
landfills only used as a last resort. These principles are incorporated in the Waste Management Guidelines formalized
in 2012 and adopted at Group sites worldwide.
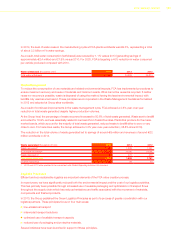
As a result of continued improvements in the waste management cycle, FCA achieved a 3.6% year-over-year
reduction in total waste generated despite higher production volumes.
At the Group level, the percentage of waste recovered increased to 80.6% of total waste generated. Waste sent to landfill
accounted for 16.9% and was essentially related to inert sand from Teksid foundries. Plants that produce for the mass-
market brands, which account for the majority of total waste generated, reduced waste to landfill either to zero or very
close to zero. For hazardous waste, the Group achieved a 3.3% year-over-year reduction (-38.8% since 2010).
The reduction in the total volume of waste generated led to savings of around €9 million and revenues of around €32
million worldwide in 2014.
Waste generated (thousands of tons) 2014 2013 2012
Waste recovered(1) 1,406 1,339 1,291
% of waste recovered(1) 80.6% 74.0% 73.3%
Waste disposed of 338 470 470
Total waste generated 1,744 1,809 1,761
of which hazardous 38 39 40
(1) 2012 and 2013 data updated to be consistent with Global Reporting Initiative G4 standard.
Logistics Processes
Efficient and eco-sustainable logistics are important elements of the FCA value creation process.
In recent years, we have significantly reduced both the environmental impact and the cost of our logistics activities.
This has primarily been possible through increased use of reusable packaging and optimization of transport flows
throughout the supply chain which has reduced emissions and traffic associated with the movement of materials,
components and finished products.
In 2010, the Group published the Green Logistics Principles as part of a process of greater coordination with our
logistics partners. These principles focus on four main areas:
low-emissions transport
intermodal transport solutions
optimized use of available transport capacity
reduced use of packaging and protective materials.
Several initiatives have been launched in support of these principles.