Chrysler 2014 Annual Report Download - page 194
Download and view the complete annual report
Please find page 194 of the 2014 Chrysler annual report below. You can navigate through the pages in the report by either clicking on the pages listed below, or by using the keyword search tool below to find specific information within the annual report.-
 1
1 -
2
-
3
-
4
-
5
-
6
-
7
-
8
-
9
-
10
-
11
-
12
-
13
-
14
-
15
-
16
-
17
-
18
-
19
-
20
-
21
-
22
-
23
-
24
-
25
-
26
-
27
-
28
-
29
-
30
-
31
-
32
-
33
-
34
-
35
-
36
-
37
-
38
-
39
-
40
-
41
-
42
-
43
-
44
-
45
-
46
-
47
-
48
-
49
-
50
-
51
-
52
-
53
-
54
-
55
-
56
-
57
-
58
-
59
-
60
-
61
-
62
-
63
-
64
-
65
-
66
-
67
-
68
-
69
-
70
-
71
-
72
-
73
-
74
-
75
-
76
-
77
-
78
-
79
-
80
-
81
-
82
-
83
-
84
-
85
-
86
-
87
-
88
-
89
-
90
-
91
-
92
-
93
-
94
-
95
-
96
-
97
-
98
-
99
-
100
-
101
-
102
-
103
-
104
-
105
-
106
-
107
-
108
-
109
-
110
-
111
-
112
-
113
-
114
-
115
-
116
-
117
-
118
-
119
-
120
-
121
-
122
-
123
-
124
-
125
-
126
-
127
-
128
-
129
-
130
-
131
-
132
-
133
-
134
-
135
-
136
-
137
-
138
-
139
-
140
-
141
-
142
-
143
-
144
-
145
-
146
-
147
-
148
-
149
-
150
-
151
-
152
-
153
-
154
-
155
-
156
-
157
-
158
-
159
-
160
-
161
-
162
-
163
-
164
-
165
-
166
-
167
-
168
-
169
-
170
-
171
-
172
-
173
-
174
-
175
-
176
-
177
-
178
-
179
-
180
-
181
-
182
-
183
-
 184
184 -
 185
185 -
 186
186 -
 187
187 -
 188
188 -
 189
189 -
 190
190 -
 191
191 -
 192
192 -
 193
193 -
 194
194 -
 195
195 -
 196
196 -
 197
197 -
 198
198 -
 199
199 -
 200
200 -
 201
201 -
 202
202 -
 203
203 -
 204
204 -
205
-
206
-
207
-
208
-
209
-
210
-
211
-
212
-
213
-
214
-
215
-
216
-
217
-
218
-
219
-
220
-
221
-
222
-
223
-
224
-
225
-
226
-
227
-
228
-
229
-
230
-
231
-
232
-
233
-
234
-
235
-
236
-
237
-
238
-
239
-
240
-
241
-
242
-
243
-
244
-
245
-
246
-
247
-
248
-
249
-
250
-
251
-
252
-
253
-
254
-
255
-
256
-
257
-
258
-
259
-
260
-
261
-
262
-
263
-
264
-
265
-
266
-
267
-
268
-
269
-
270
-
271
-
272
-
273
-
274
-
275
-
276
-
277
-
278
-
279
-
280
-
281
-
282
-
283
-
284
-
285
-
286
-
287
-
288
-
289
-
290
-
291
-
292
-
293
-
294
-
295
-
296
-
297
-
298
-
299
-
300
-
301
-
302
-
303
 |
 |

192 2014 | ANNUAL REPORT
Consolidated
Financial Statements
Notes to the Consolidated
Financial Statements
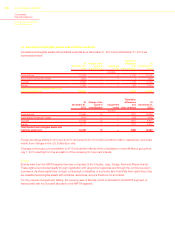
Pre-tax expected future cash flows have been estimated in U.S. Dollars, and discounted using a pre-tax
discount rate. The base WACC of 16.4 percent (16.0 percent in 2013, 15.1 percent in 2012) used reflects the
current market assessment of the time value of money for the period being considered and the risks specific to
the segment under consideration. The WACC was calculated using the Capital Asset Pricing Model (“CAPM”)
technique in which the risk-free rate has been calculated by referring to the yield curve of long-term U.S.
government bonds and the beta coefficient and the debt/equity ratio have been extrapolated by analyzing a
group of comparable companies operating in the automotive sector. Additionally, to reflect the uncertainty of the
current economic environment and future market conditions, the cost of equity component of the WACC was
progressively increased by a 100 basis point risk premium for the years 2016 and 2017, 90 basis points for 2018
and by 100 basis points in the terminal period.
The value in use estimated as above was determined to be in excess of the book value of the net capital
employed (inclusive of Goodwill and Brands allocated to the NAFTA segment) by approximately €100 million at
December 31, 2014.
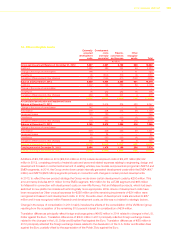
Impairment tests for Goodwill allocated to other segments were based on the expected future cash flows covering
the period from 2015 through 2018. The assumptions used to determine the pre-tax WACCs and the risk premiums
were consistent with those described above for the NAFTA segment. Discounted cash flows were measured using
a pre-tax base WACC of 16.6 percent (14.9 percent in 2013, 14.4 percent in 2012), 18.0 percent (22.3 percent in
2013, 17.2 percent in 2012) and 16.4 percent (17.9 percent in 2013, 16.4 percent in 2012) for the APAC, LATAM and
EMEA segments, respectively. The results of the impairment tests for APAC, LATAM and EMEA resulted in a positive
outcome reflecting a surplus of the value in use over the book value. A sensitivity analysis was performed by increasing
the base WACC used above for each of the regions by 50 basis points, which resulted in a surplus of the carrying
amount over the value in use for the APAC, LATAM and EMEA segments.
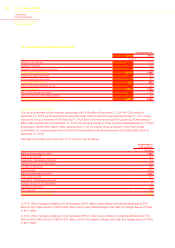
In addition, the Goodwill recorded within the Ferrari operating segment was tested for impairment. The expected
future cash flows are the operating cash flows taken from the estimates included in the 2015 budget and the expected
business performance, taking account of the uncertainties of the global financial and economic situation, extrapolated
for subsequent years by using the specific medium/long-term growth rate for the sector equal to 1.0 percent (1.0
percent in 2013, 2.0 percent in 2012). These cash flows were then discounted using a post-tax discount rate of
8.2 percent (8.4 percent in 2013, 8.1 percent in 2012). The recoverable amount of the CGU was significantly higher
than its carrying amount. Furthermore, the exclusivity of the business, its historical profitability and its future earnings
prospects indicate that the carrying amount of the Goodwill within the Ferrari operating segment will continue to be
recoverable, even in the event of difficult economic and market condition.