Chrysler 2014 Annual Report Download - page 189
Download and view the complete annual report
Please find page 189 of the 2014 Chrysler annual report below. You can navigate through the pages in the report by either clicking on the pages listed below, or by using the keyword search tool below to find specific information within the annual report.-
 1
1 -
2
-
3
-
4
-
5
-
6
-
7
-
8
-
9
-
10
-
11
-
12
-
13
-
14
-
15
-
16
-
17
-
18
-
19
-
20
-
21
-
22
-
23
-
24
-
25
-
26
-
27
-
28
-
29
-
30
-
31
-
32
-
33
-
34
-
35
-
36
-
37
-
38
-
39
-
40
-
41
-
42
-
43
-
44
-
45
-
46
-
47
-
48
-
49
-
50
-
51
-
52
-
53
-
54
-
55
-
56
-
57
-
58
-
59
-
60
-
61
-
62
-
63
-
64
-
65
-
66
-
67
-
68
-
69
-
70
-
71
-
72
-
73
-
74
-
75
-
76
-
77
-
78
-
79
-
80
-
81
-
82
-
83
-
84
-
85
-
86
-
87
-
88
-
89
-
90
-
91
-
92
-
93
-
94
-
95
-
96
-
97
-
98
-
99
-
100
-
101
-
102
-
103
-
104
-
105
-
106
-
107
-
108
-
109
-
110
-
111
-
112
-
113
-
114
-
115
-
116
-
117
-
118
-
119
-
120
-
121
-
122
-
123
-
124
-
125
-
126
-
127
-
128
-
129
-
130
-
131
-
132
-
133
-
134
-
135
-
136
-
137
-
138
-
139
-
140
-
141
-
142
-
143
-
144
-
145
-
146
-
147
-
148
-
149
-
150
-
151
-
152
-
153
-
154
-
155
-
156
-
157
-
158
-
159
-
160
-
161
-
162
-
163
-
164
-
165
-
166
-
167
-
168
-
169
-
170
-
171
-
172
-
173
-
174
-
175
-
176
-
177
-
178
-
 179
179 -
 180
180 -
 181
181 -
 182
182 -
 183
183 -
 184
184 -
 185
185 -
 186
186 -
 187
187 -
 188
188 -
 189
189 -
 190
190 -
 191
191 -
 192
192 -
 193
193 -
 194
194 -
 195
195 -
 196
196 -
 197
197 -
 198
198 -
 199
199 -
200
-
201
-
202
-
203
-
204
-
205
-
206
-
207
-
208
-
209
-
210
-
211
-
212
-
213
-
214
-
215
-
216
-
217
-
218
-
219
-
220
-
221
-
222
-
223
-
224
-
225
-
226
-
227
-
228
-
229
-
230
-
231
-
232
-
233
-
234
-
235
-
236
-
237
-
238
-
239
-
240
-
241
-
242
-
243
-
244
-
245
-
246
-
247
-
248
-
249
-
250
-
251
-
252
-
253
-
254
-
255
-
256
-
257
-
258
-
259
-
260
-
261
-
262
-
263
-
264
-
265
-
266
-
267
-
268
-
269
-
270
-
271
-
272
-
273
-
274
-
275
-
276
-
277
-
278
-
279
-
280
-
281
-
282
-
283
-
284
-
285
-
286
-
287
-
288
-
289
-
290
-
291
-
292
-
293
-
294
-
295
-
296
-
297
-
298
-
299
-
300
-
301
-
302
-
303
 |
 |

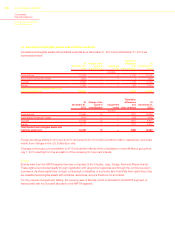
2014 | ANNUAL REPORT 187
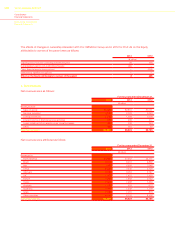
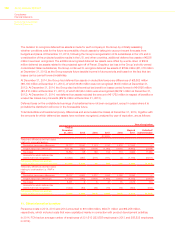
The significant components of Deferred tax assets and liabilities and their changes during the years ended December
31, 2014 and 2013 were as follows:
At January 1,
2014
Recognized in
Consolidated
income
statement
Charged
to equity
Changes in
the scope of
consolidation
Translation
differences
and other
changes
At
December 31,
2014
(€ million)
Deferred tax assets arising on:
Provisions 2,938 533 — 4 1,092 4,567
Provision for employee benefits 1,131 101 35 — 145 1,412
Intangible assets 343 (31) — — 16 328
Impairment of financial assets 191 (7) — — (10) 174
Inventories 261 41 — — 8 310
Allowances for doubtful accounts 110 — — — 1 111
Other 1,209 (947) 42 (4) 1,460 1,760
Total 6,183 (310) 77 — 2,712 8,662
Deferred tax liabilities arising on:
Accelerated depreciation (1,404) (80) — — (1,222) (2,706)
Capitalization of development costs (1,416) (155) — 2 (407) (1,976)
Other Intangible assets and
Intangible assets with indefinite
useful lives (640) 23 — 16 (695) (1,296)
Provision for employee benefits (20) 2 (2) — (1) (21)
Other (562) (56) 27 (16) (24) (631)
Total (4,042) (266) 25 2 (2,349) (6,630)
Deferred tax asset arising on tax loss
carry-forward 3,810 777 — — 109 4,696
Unrecognized deferred tax assets (3,326) (56) — (2) (30) (3,414)
Total net Deferred tax assets 2,625 145 102 — 442 3,314
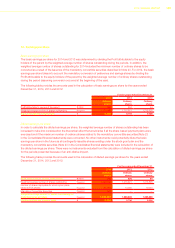
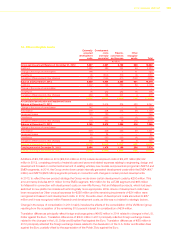
At January 1,
2013
Recognized in
Consolidated
income
statement
Charged
to equity
Changes in
the scope of
consolidation
Translation
differences
and other
changes
At
December
31, 2013
(€ million)
Deferred tax assets arising on:
Provisions 2,922 368 — 3 (355) 2,938
Provision for employee benefits 1,022 137 18 — (46) 1,131
Intangible assets 381 (38) — 1 (1) 343
Impairment of financial assets 228 13 — — (50) 191
Inventories 264 (1) — 1 (3) 261
Allowances for doubtful accounts 90 18 — — 2 110
Other 1,456 (224) — 2 (25) 1,209
Total 6,363 273 18 7 (478) 6,183
Deferred tax liabilities arising on:
Accelerated depreciation (1,354) (128) — 1 77 (1,404)
Capitalization of development costs (1,211) (252) — — 47 (1,416)
Other Intangible assets and
Intangible assets with indefinite
useful lives (784) 48 — (17) 113 (640)
Provision for employee benefits (22) — — (1) 3 (20)
Other (527) 54 (23) (2) (64) (562)
Total (3,898) (278) (23) (19) 176 (4,042)
Deferred tax asset arising on tax loss
carry-forward 3,399 437 — 7 (33) 3,810
Unrecognized deferred tax assets (4,918) 1,138 217 — 237 (3,326)
Total net Deferred tax assets 946 1,570 212 (5) (98) 2,625