Chrysler 2014 Annual Report Download - page 60
Download and view the complete annual report
Please find page 60 of the 2014 Chrysler annual report below. You can navigate through the pages in the report by either clicking on the pages listed below, or by using the keyword search tool below to find specific information within the annual report.-
 1
1 -
2
-
3
-
4
-
5
-
6
-
7
-
8
-
9
-
10
-
11
-
12
-
13
-
14
-
15
-
16
-
17
-
18
-
19
-
20
-
21
-
22
-
23
-
24
-
25
-
26
-
27
-
28
-
29
-
30
-
31
-
32
-
33
-
34
-
35
-
36
-
37
-
38
-
39
-
40
-
41
-
42
-
43
-
44
-
45
-
46
-
47
-
48
-
49
-
 50
50 -
 51
51 -
 52
52 -
 53
53 -
 54
54 -
 55
55 -
 56
56 -
 57
57 -
 58
58 -
 59
59 -
 60
60 -
 61
61 -
 62
62 -
 63
63 -
 64
64 -
 65
65 -
 66
66 -
 67
67 -
 68
68 -
 69
69 -
 70
70 -
71
-
72
-
73
-
74
-
75
-
76
-
77
-
78
-
79
-
80
-
81
-
82
-
83
-
84
-
85
-
86
-
87
-
88
-
89
-
90
-
91
-
92
-
93
-
94
-
95
-
96
-
97
-
98
-
99
-
100
-
101
-
102
-
103
-
104
-
105
-
106
-
107
-
108
-
109
-
110
-
111
-
112
-
113
-
114
-
115
-
116
-
117
-
118
-
119
-
120
-
121
-
122
-
123
-
124
-
125
-
126
-
127
-
128
-
129
-
130
-
131
-
132
-
133
-
134
-
135
-
136
-
137
-
138
-
139
-
140
-
141
-
142
-
143
-
144
-
145
-
146
-
147
-
148
-
149
-
150
-
151
-
152
-
153
-
154
-
155
-
156
-
157
-
158
-
159
-
160
-
161
-
162
-
163
-
164
-
165
-
166
-
167
-
168
-
169
-
170
-
171
-
172
-
173
-
174
-
175
-
176
-
177
-
178
-
179
-
180
-
181
-
182
-
183
-
184
-
185
-
186
-
187
-
188
-
189
-
190
-
191
-
192
-
193
-
194
-
195
-
196
-
197
-
198
-
199
-
200
-
201
-
202
-
203
-
204
-
205
-
206
-
207
-
208
-
209
-
210
-
211
-
212
-
213
-
214
-
215
-
216
-
217
-
218
-
219
-
220
-
221
-
222
-
223
-
224
-
225
-
226
-
227
-
228
-
229
-
230
-
231
-
232
-
233
-
234
-
235
-
236
-
237
-
238
-
239
-
240
-
241
-
242
-
243
-
244
-
245
-
246
-
247
-
248
-
249
-
250
-
251
-
252
-
253
-
254
-
255
-
256
-
257
-
258
-
259
-
260
-
261
-
262
-
263
-
264
-
265
-
266
-
267
-
268
-
269
-
270
-
271
-
272
-
273
-
274
-
275
-
276
-
277
-
278
-
279
-
280
-
281
-
282
-
283
-
284
-
285
-
286
-
287
-
288
-
289
-
290
-
291
-
292
-
293
-
294
-
295
-
296
-
297
-
298
-
299
-
300
-
301
-
302
-
303
 |
 |

58 2014 | ANNUAL REPORT
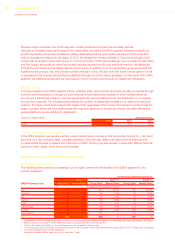
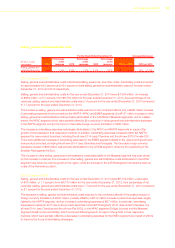
Operating Results
2014 compared to 2013
Cost of sales for the year ended December 31, 2014 was €83.1 billion, an increase of €8.8 billion, or 11.9 percent
(12.8 percent on a constant currency basis), from €74.3 billion for the year ended December 31, 2013.
As a percentage of net revenues, cost of sales was 86.5 percent for the year ended December 31, 2014 compared to
85.8 percent for the year ended December 31, 2013.
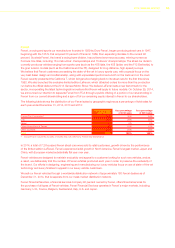
The increase in cost of sales was primarily due to the combination of (i) €5.6 billion related to increased vehicle
shipments, primarily in the NAFTA, APAC, Maserati and EMEA segments, partially offset by a reduction in LATAM
shipments, (ii) €2.5 billion related to vehicle and distribution channel mix primarily attributable to the NAFTA segment,
and (iii) €0.5 billion arising primarily from price increases for certain raw materials in LATAM, which were partially offset
by (iv) favorable foreign currency translation effect of €0.7 billion.
In particular, the €2.5 billion increase in cost of sales related to vehicle and distribution channel mix was primarily
driven by the higher percentage of growth in certain SUV shipments as compared to passenger car shipments, along
with more retail shipments relative to fleet shipments in NAFTA.
Cost of sales for the year ended December 31, 2014 increased by approximately €800 million due to an increase of
warranty expense and also included the effects of recently approved recall campaigns in the NAFTA segment.
The favorable foreign currency translation impact of €0.7 billion was primarily attributable to the LATAM segment,
driven by the weakening of the Brazilian Real against the Euro.
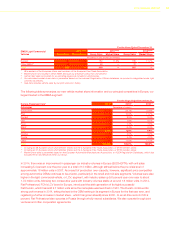
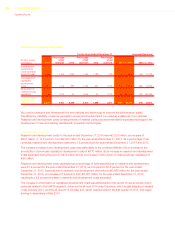
2013 compared to 2012
Cost of sales for the year ended December 31, 2013 was €74.3 billion, an increase of €2.8 billion, or 4.0 percent
(7.9 percent on a constant currency basis), from €71.5 billion for the year ended December 31, 2012. As a
percentage of net revenues, cost of sales was 85.8 percent for the year ended December 31, 2013 compared to
85.3 percent for the year ended December 31, 2012.
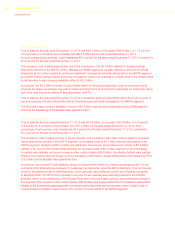
The increase in costs of sales was due to the combination of (i) increased costs of €2.1 billion related to increased
vehicle shipments, primarily in the NAFTA segment, (ii) increased costs of €1.7 billion primarily attributable to the
NAFTA segment, related to shifts in vehicle and distribution channel mix, (iii) increased cost of sales of €0.9 billion
relating to the new-model content enhancements, (iv) increased costs of €0.5 billion arising from price increases
for certain raw materials, and (v) an increase in other costs of sales of €0.5 billion, the effects of which were partially
offset by the positive impact of foreign currency translation of €2.8 billion, largely attributable to the weakening of the
U.S. Dollar and the Brazilian Real against the Euro.
In particular, the increase in cost related to vehicle mix was primarily driven by a higher percentage growth in truck
and certain SUV shipments as compared to passenger car shipments, while the shift in distribution channel mix was
driven by the relative growth in retail shipments, which generally have additional content per vehicle as compared
to fleet shipments. The €0.5 billion increase in the price of raw materials was particularly related to the LATAM
segment, driven by the weakening of the Brazilian Real, which impacts foreign currency denominated purchases in
that segment. The increase in other costs of sales of €0.5 billion was largely attributable to increases in depreciation
relating to the investments associated with our recent product launches and an increase in labor costs in order to
meet increased production requirements both of which primarily related to the NAFTA segment.