Chrysler 2014 Annual Report Download - page 169
Download and view the complete annual report
Please find page 169 of the 2014 Chrysler annual report below. You can navigate through the pages in the report by either clicking on the pages listed below, or by using the keyword search tool below to find specific information within the annual report.-
 1
1 -
2
-
3
-
4
-
5
-
6
-
7
-
8
-
9
-
10
-
11
-
12
-
13
-
14
-
15
-
16
-
17
-
18
-
19
-
20
-
21
-
22
-
23
-
24
-
25
-
26
-
27
-
28
-
29
-
30
-
31
-
32
-
33
-
34
-
35
-
36
-
37
-
38
-
39
-
40
-
41
-
42
-
43
-
44
-
45
-
46
-
47
-
48
-
49
-
50
-
51
-
52
-
53
-
54
-
55
-
56
-
57
-
58
-
59
-
60
-
61
-
62
-
63
-
64
-
65
-
66
-
67
-
68
-
69
-
70
-
71
-
72
-
73
-
74
-
75
-
76
-
77
-
78
-
79
-
80
-
81
-
82
-
83
-
84
-
85
-
86
-
87
-
88
-
89
-
90
-
91
-
92
-
93
-
94
-
95
-
96
-
97
-
98
-
99
-
100
-
101
-
102
-
103
-
104
-
105
-
106
-
107
-
108
-
109
-
110
-
111
-
112
-
113
-
114
-
115
-
116
-
117
-
118
-
119
-
120
-
121
-
122
-
123
-
124
-
125
-
126
-
127
-
128
-
129
-
130
-
131
-
132
-
133
-
134
-
135
-
136
-
137
-
138
-
139
-
140
-
141
-
142
-
143
-
144
-
145
-
146
-
147
-
148
-
149
-
150
-
151
-
152
-
153
-
154
-
155
-
156
-
157
-
158
-
 159
159 -
 160
160 -
 161
161 -
 162
162 -
 163
163 -
 164
164 -
 165
165 -
 166
166 -
 167
167 -
 168
168 -
 169
169 -
 170
170 -
 171
171 -
 172
172 -
 173
173 -
 174
174 -
 175
175 -
 176
176 -
 177
177 -
 178
178 -
 179
179 -
180
-
181
-
182
-
183
-
184
-
185
-
186
-
187
-
188
-
189
-
190
-
191
-
192
-
193
-
194
-
195
-
196
-
197
-
198
-
199
-
200
-
201
-
202
-
203
-
204
-
205
-
206
-
207
-
208
-
209
-
210
-
211
-
212
-
213
-
214
-
215
-
216
-
217
-
218
-
219
-
220
-
221
-
222
-
223
-
224
-
225
-
226
-
227
-
228
-
229
-
230
-
231
-
232
-
233
-
234
-
235
-
236
-
237
-
238
-
239
-
240
-
241
-
242
-
243
-
244
-
245
-
246
-
247
-
248
-
249
-
250
-
251
-
252
-
253
-
254
-
255
-
256
-
257
-
258
-
259
-
260
-
261
-
262
-
263
-
264
-
265
-
266
-
267
-
268
-
269
-
270
-
271
-
272
-
273
-
274
-
275
-
276
-
277
-
278
-
279
-
280
-
281
-
282
-
283
-
284
-
285
-
286
-
287
-
288
-
289
-
290
-
291
-
292
-
293
-
294
-
295
-
296
-
297
-
298
-
299
-
300
-
301
-
302
-
303
 |
 |

2014 | ANNUAL REPORT 167
Other post-employment benefits
The Group provides health care, legal, severance indemnity and life insurance benefits to certain hourly and salaried
employees. Upon retirement, these employees may become eligible for continuation of certain benefits. Benefits and
eligibility rules may be modified periodically.
Health care, life insurance plans and other employment benefits are accounted for on an actuarial basis, which
requires the selection of various assumptions. The estimation of the Group’s obligations, costs and liabilities
associated with these plans requires the use of estimates of the present value of the projected future payments to
all participants, taking into consideration parameters of a financial nature such as discount rate, the rates of salary
increases and the likelihood of potential future events estimated by using demographic assumptions such as mortality,
dismissal and retirement rates.
Plan obligations and costs are based on existing plan provisions. Assumptions regarding any potential future changes
to benefit provisions beyond those to which the Group is presently committed are not made.
The assumptions used in developing the required estimates include the following key factors:
Discount rates. The Group selects discount rates on the basis of the rate of return on high-quality (AA-rated) fixed
income investments for which the timing and amounts of payments match the timing and amounts of the projected
benefit payments.
Health care cost trends. The Group’s health care cost trend assumptions are developed based on historical cost
data, the near-term outlook, and an assessment of likely long-term trends.
Salary growth. The salary growth assumptions reflect the Group’s long-term actual experience, outlook and
assumed inflation.
Retirement and employee leaving rates. Retirement and employee leaving rates are developed to reflect actual and
projected plan experience, as well as legal requirements for retirement in respective countries.
Mortality rates. Mortality rates are developed using our plan-specific populations, recent mortality information
published by recognized experts in this field and other data where appropriate to reflect actual and projected plan
experience.
Additionally, retirement rate assumptions used for our U.S. benefit plan valuations were updated to reflect an ongoing
trend towards delayed retirement for FCA US employees. The change decreased our other post-employment benefit
obligations by approximately €40 million.
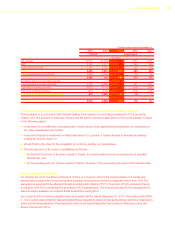
At December 31, 2014 the effect of the indicated decreases or increases in the key factors affecting the health
care, life insurance plans and severance indemnity in Italy (trattamento di fine rapporto or “TFR”), holding all other
assumptions constant, is shown below:
Effect on health
care and life
insurance defined
benefit obligation
Effect on the TFR
obligation
(€ million)
10 basis point / (100 basis point for TFR) decrease in discount rate 28 55
10 basis point / (100 basis point for TFR), increase in discount rate (28) (49)
100 basis point decrease in health care cost trend rate (43) —
100 basis point increase in health care cost trend rate 50 —