Chrysler 2014 Annual Report Download - page 68
Download and view the complete annual report
Please find page 68 of the 2014 Chrysler annual report below. You can navigate through the pages in the report by either clicking on the pages listed below, or by using the keyword search tool below to find specific information within the annual report.-
 1
1 -
2
-
3
-
4
-
5
-
6
-
7
-
8
-
9
-
10
-
11
-
12
-
13
-
14
-
15
-
16
-
17
-
18
-
19
-
20
-
21
-
22
-
23
-
24
-
25
-
26
-
27
-
28
-
29
-
30
-
31
-
32
-
33
-
34
-
35
-
36
-
37
-
38
-
39
-
40
-
41
-
42
-
43
-
44
-
45
-
46
-
47
-
48
-
49
-
50
-
51
-
52
-
53
-
54
-
55
-
56
-
57
-
 58
58 -
 59
59 -
 60
60 -
 61
61 -
 62
62 -
 63
63 -
 64
64 -
 65
65 -
 66
66 -
 67
67 -
 68
68 -
 69
69 -
 70
70 -
 71
71 -
 72
72 -
 73
73 -
 74
74 -
 75
75 -
 76
76 -
 77
77 -
 78
78 -
79
-
80
-
81
-
82
-
83
-
84
-
85
-
86
-
87
-
88
-
89
-
90
-
91
-
92
-
93
-
94
-
95
-
96
-
97
-
98
-
99
-
100
-
101
-
102
-
103
-
104
-
105
-
106
-
107
-
108
-
109
-
110
-
111
-
112
-
113
-
114
-
115
-
116
-
117
-
118
-
119
-
120
-
121
-
122
-
123
-
124
-
125
-
126
-
127
-
128
-
129
-
130
-
131
-
132
-
133
-
134
-
135
-
136
-
137
-
138
-
139
-
140
-
141
-
142
-
143
-
144
-
145
-
146
-
147
-
148
-
149
-
150
-
151
-
152
-
153
-
154
-
155
-
156
-
157
-
158
-
159
-
160
-
161
-
162
-
163
-
164
-
165
-
166
-
167
-
168
-
169
-
170
-
171
-
172
-
173
-
174
-
175
-
176
-
177
-
178
-
179
-
180
-
181
-
182
-
183
-
184
-
185
-
186
-
187
-
188
-
189
-
190
-
191
-
192
-
193
-
194
-
195
-
196
-
197
-
198
-
199
-
200
-
201
-
202
-
203
-
204
-
205
-
206
-
207
-
208
-
209
-
210
-
211
-
212
-
213
-
214
-
215
-
216
-
217
-
218
-
219
-
220
-
221
-
222
-
223
-
224
-
225
-
226
-
227
-
228
-
229
-
230
-
231
-
232
-
233
-
234
-
235
-
236
-
237
-
238
-
239
-
240
-
241
-
242
-
243
-
244
-
245
-
246
-
247
-
248
-
249
-
250
-
251
-
252
-
253
-
254
-
255
-
256
-
257
-
258
-
259
-
260
-
261
-
262
-
263
-
264
-
265
-
266
-
267
-
268
-
269
-
270
-
271
-
272
-
273
-
274
-
275
-
276
-
277
-
278
-
279
-
280
-
281
-
282
-
283
-
284
-
285
-
286
-
287
-
288
-
289
-
290
-
291
-
292
-
293
-
294
-
295
-
296
-
297
-
298
-
299
-
300
-
301
-
302
-
303
 |
 |

66 2014 | ANNUAL REPORT
Operating Results
2013 compared to 2012
Tax income for the year ended December 31, 2013 was €936 million, compared to tax expense of €628 million for
the year ended December 31, 2012.
The increase in tax income was due to the recognition of previously unrecognized deferred tax assets related to FCA
US of €1,500 million. The FCA US deferred tax assets were recognized as a result of the recoverability assessment
performed at December 31, 2013, which reached the conclusion that it was probable that future taxable profit will
allow the deferred tax assets to be recovered. For further details of the recoverability assessment. Excluding the effect
of the previously unrecognized deferred tax assets, the effective rate of tax would have been 48.7 percent compared
to 35.7 percent for 2012. See Note 10 to the Consolidated financial statements included elsewhere in this report for a
reconciliation of the theoretical tax expense to the effective tax charge. The increase in the effective tax rate was mainly
attributable to lower utilization of tax losses carried forward for which deferred tax assets had not been recognized in
the past, partially offset by lower unrecognized deferred tax assets on temporary differences and tax losses arising in
the year.
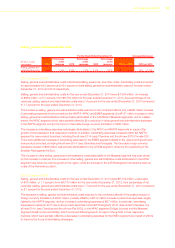
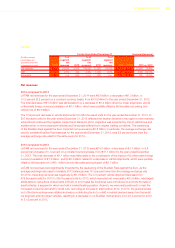
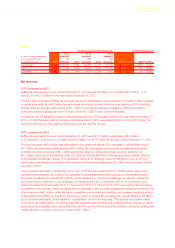
Segments
The following is a discussion of net revenues, EBIT and shipments for each segment.
(€ million, except
shipments which are
in thousands of units)
Net revenues
for the years ended
December 31,
EBIT
for the years ended
December 31,
Shipments(*)
for the years ended
December 31,
2014 2013 2012 2014 2013 2012 2014 2013 2012
NAFTA 52,452 45,777 43,521 1,647 2,290 2,491 2,493 2,238 2,115
LATAM 8,629 9,973 11,062 177 492 1,025 827 950 979
APAC 6,259 4,668 3,173 537 335 274 220 163 103
EMEA 18,020 17,335 17,717 (109) (506) (725) 1,024 979 1,012
Ferrari 2,762 2,335 2,225 389 364 335 77 7
Maserati 2,767 1,659 755 275 106 57 36 15 6
Components 8,619 8,080 8,030 260 146 165 n.m. n.m. n.m.
Other activities 831 929 979 (114) (167) (149) n.m. n.m. n.m.
Unallocated items
& adjustments(1) (4,249) (4,132) (3,697) 161 (58) (39) n.m. n.m. n.m.
Total 96,090 86,624 83,765 3,223 3,002 3,434 4,608 4,352 4,223
(1) Primarily includes intercompany transactions which are eliminated on consolidation.
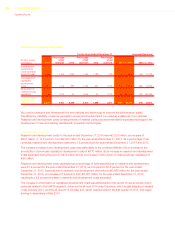
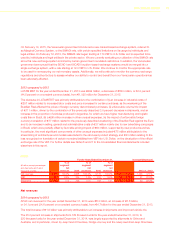
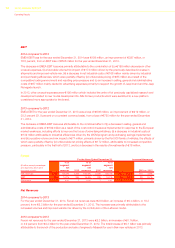
NAFTA
For the Years Ended December 31, Increase/(decrease)
(€ million, except percentages
and shipments which are in
thousands of units) 2014
% of
segment
net
revenues 2013
% of
segment
net
revenues 2012
% of
segment
net
revenues 2014 vs. 2013 2013 vs. 2012
Net revenues 52,452 100.0% 45,777 100.0% 43,521 100.0% 6,675 14.6% 2,256 5.2%
EBIT 1,647 3.1% 2,290 5.0% 2,491 5.7% (643) (28.1)% (201) (8.1)%
Shipments 2,493 n.m. 2,238 n.m. 2,115 n.m. 255 11.4% 123 5.8%