Chrysler 2014 Annual Report Download - page 79
Download and view the complete annual report
Please find page 79 of the 2014 Chrysler annual report below. You can navigate through the pages in the report by either clicking on the pages listed below, or by using the keyword search tool below to find specific information within the annual report.-
 1
1 -
2
-
3
-
4
-
5
-
6
-
7
-
8
-
9
-
10
-
11
-
12
-
13
-
14
-
15
-
16
-
17
-
18
-
19
-
20
-
21
-
22
-
23
-
24
-
25
-
26
-
27
-
28
-
29
-
30
-
31
-
32
-
33
-
34
-
35
-
36
-
37
-
38
-
39
-
40
-
41
-
42
-
43
-
44
-
45
-
46
-
47
-
48
-
49
-
50
-
51
-
52
-
53
-
54
-
55
-
56
-
57
-
58
-
59
-
60
-
61
-
62
-
63
-
64
-
65
-
66
-
67
-
68
-
 69
69 -
 70
70 -
 71
71 -
 72
72 -
 73
73 -
 74
74 -
 75
75 -
 76
76 -
 77
77 -
 78
78 -
 79
79 -
 80
80 -
 81
81 -
 82
82 -
 83
83 -
 84
84 -
 85
85 -
 86
86 -
 87
87 -
 88
88 -
 89
89 -
90
-
91
-
92
-
93
-
94
-
95
-
96
-
97
-
98
-
99
-
100
-
101
-
102
-
103
-
104
-
105
-
106
-
107
-
108
-
109
-
110
-
111
-
112
-
113
-
114
-
115
-
116
-
117
-
118
-
119
-
120
-
121
-
122
-
123
-
124
-
125
-
126
-
127
-
128
-
129
-
130
-
131
-
132
-
133
-
134
-
135
-
136
-
137
-
138
-
139
-
140
-
141
-
142
-
143
-
144
-
145
-
146
-
147
-
148
-
149
-
150
-
151
-
152
-
153
-
154
-
155
-
156
-
157
-
158
-
159
-
160
-
161
-
162
-
163
-
164
-
165
-
166
-
167
-
168
-
169
-
170
-
171
-
172
-
173
-
174
-
175
-
176
-
177
-
178
-
179
-
180
-
181
-
182
-
183
-
184
-
185
-
186
-
187
-
188
-
189
-
190
-
191
-
192
-
193
-
194
-
195
-
196
-
197
-
198
-
199
-
200
-
201
-
202
-
203
-
204
-
205
-
206
-
207
-
208
-
209
-
210
-
211
-
212
-
213
-
214
-
215
-
216
-
217
-
218
-
219
-
220
-
221
-
222
-
223
-
224
-
225
-
226
-
227
-
228
-
229
-
230
-
231
-
232
-
233
-
234
-
235
-
236
-
237
-
238
-
239
-
240
-
241
-
242
-
243
-
244
-
245
-
246
-
247
-
248
-
249
-
250
-
251
-
252
-
253
-
254
-
255
-
256
-
257
-
258
-
259
-
260
-
261
-
262
-
263
-
264
-
265
-
266
-
267
-
268
-
269
-
270
-
271
-
272
-
273
-
274
-
275
-
276
-
277
-
278
-
279
-
280
-
281
-
282
-
283
-
284
-
285
-
286
-
287
-
288
-
289
-
290
-
291
-
292
-
293
-
294
-
295
-
296
-
297
-
298
-
299
-
300
-
301
-
302
-
303
 |
 |

2014 | ANNUAL REPORT 77
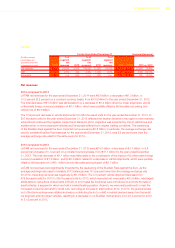
2013 compared to 2012
Components net revenues for the year ended December 31, 2013 were €8.1 billion, an increase of €0.1 billion,
or 0.6 percent (4.4 percent on a constant currency basis), from €8.0 billion for the year ended December 2012.
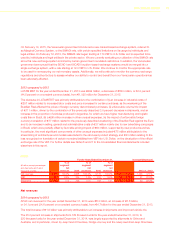
Magneti Marelli
Magneti Marelli net revenues for 2013 were €6.0 billion, an increase of €0.2 billion, or 2.7 percent, from €5.8 billion
for 2012, primarily driven by the performance of the automotive lighting and to a lesser extent, the electronics business
units. See Overview—Components Segment—Magneti Marelli for a description of the Magneti Marelli business
lines. In particular, the automotive lighting net revenues increased by 11.6 percent driven by large orders from Asian
and North American OEM clients, and the effect of the full-year contribution of lighting solutions launched in the
second half of 2012, while electronics net revenues increased by 7.0 percent, driven by the trend of increasingly
technologically advanced vehicle components.
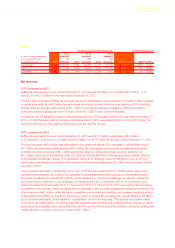
Teksid
Teksid net revenues for the year ended December 31, 2013 were €0.7 billion, a decrease of €0.1 billion,
or 11.8 percent, from €0.8 billion for 2012, attributable to a €0.1 billion decrease in net revenues from the cast iron
business, attributable to a decrease in iron prices and a decrease in cast iron volumes sold.
Comau
Comau net revenues for both years ended December 31, 2013 and December 31, 2012 were €1.5 billion, attributable
to the combined effects of (i) an increase in body welding revenues supported by large orders from European and
North American customers, which was offset by (ii) decreased powertrain revenues. See Overview—Components
Segment—Comau for a description of the Comau business lines.
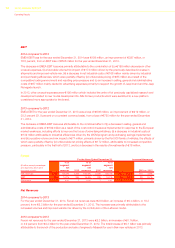
EBIT
2014 compared to 2013
Components EBIT for the year ended December 31, 2014 was €260 million, an increase of €114 million,
or 78.1 percent, from €146 million for the year ended December 31, 2013.
Magneti Marelli
Magneti Marelli EBIT for the year ended December 31, 2014 EBIT was €204 million, an increase of €35 million,
20.7 percent, from €169 million for the year ended December 31, 2013. EBIT includes unusual charges of €20 million
for 2014 (unusual income of €1 million for 2013). Excluding these unusual charges, EBIT increased by €56 million,
mainly reflecting higher volumes and the benefit of cost containment actions and efficiencies.
Teksid
Teksid EBIT loss for the year ended December 31, 2014 was €4 million, a decrease of €66 million, from an EBIT loss
of €70 million for the year ended December 31, 2013. In 2013, EBIT included unusual charges of €60 million, mainly
related to impairment of assets in the Cast Iron business unit.
Comau
Comau EBIT for the year ended December 31, 2014 was €60 million, an increase of €13 million, or 27.7 percent,
from €47 million for the year ended December 31, 2013, primarily due to volume in body welding operations and an
improved mix.