Chrysler 2014 Annual Report Download - page 255
Download and view the complete annual report
Please find page 255 of the 2014 Chrysler annual report below. You can navigate through the pages in the report by either clicking on the pages listed below, or by using the keyword search tool below to find specific information within the annual report.-
 1
1 -
2
-
3
-
4
-
5
-
6
-
7
-
8
-
9
-
10
-
11
-
12
-
13
-
14
-
15
-
16
-
17
-
18
-
19
-
20
-
21
-
22
-
23
-
24
-
25
-
26
-
27
-
28
-
29
-
30
-
31
-
32
-
33
-
34
-
35
-
36
-
37
-
38
-
39
-
40
-
41
-
42
-
43
-
44
-
45
-
46
-
47
-
48
-
49
-
50
-
51
-
52
-
53
-
54
-
55
-
56
-
57
-
58
-
59
-
60
-
61
-
62
-
63
-
64
-
65
-
66
-
67
-
68
-
69
-
70
-
71
-
72
-
73
-
74
-
75
-
76
-
77
-
78
-
79
-
80
-
81
-
82
-
83
-
84
-
85
-
86
-
87
-
88
-
89
-
90
-
91
-
92
-
93
-
94
-
95
-
96
-
97
-
98
-
99
-
100
-
101
-
102
-
103
-
104
-
105
-
106
-
107
-
108
-
109
-
110
-
111
-
112
-
113
-
114
-
115
-
116
-
117
-
118
-
119
-
120
-
121
-
122
-
123
-
124
-
125
-
126
-
127
-
128
-
129
-
130
-
131
-
132
-
133
-
134
-
135
-
136
-
137
-
138
-
139
-
140
-
141
-
142
-
143
-
144
-
145
-
146
-
147
-
148
-
149
-
150
-
151
-
152
-
153
-
154
-
155
-
156
-
157
-
158
-
159
-
160
-
161
-
162
-
163
-
164
-
165
-
166
-
167
-
168
-
169
-
170
-
171
-
172
-
173
-
174
-
175
-
176
-
177
-
178
-
179
-
180
-
181
-
182
-
183
-
184
-
185
-
186
-
187
-
188
-
189
-
190
-
191
-
192
-
193
-
194
-
195
-
196
-
197
-
198
-
199
-
200
-
201
-
202
-
203
-
204
-
205
-
206
-
207
-
208
-
209
-
210
-
211
-
212
-
213
-
214
-
215
-
216
-
217
-
218
-
219
-
220
-
221
-
222
-
223
-
224
-
225
-
226
-
227
-
228
-
229
-
230
-
231
-
232
-
233
-
234
-
235
-
236
-
237
-
238
-
239
-
240
-
241
-
242
-
243
-
244
-
 245
245 -
 246
246 -
 247
247 -
 248
248 -
 249
249 -
 250
250 -
 251
251 -
 252
252 -
 253
253 -
 254
254 -
 255
255 -
 256
256 -
 257
257 -
 258
258 -
 259
259 -
 260
260 -
 261
261 -
 262
262 -
 263
263 -
 264
264 -
 265
265 -
266
-
267
-
268
-
269
-
270
-
271
-
272
-
273
-
274
-
275
-
276
-
277
-
278
-
279
-
280
-
281
-
282
-
283
-
284
-
285
-
286
-
287
-
288
-
289
-
290
-
291
-
292
-
293
-
294
-
295
-
296
-
297
-
298
-
299
-
300
-
301
-
302
-
303
 |
 |

2014 | ANNUAL REPORT 253
The Group utilizes derivative financial instruments designated as fair value hedges mainly to hedge:
the foreign currency exchange rate risk on financial instruments denominated in foreign currency; and
the interest rate risk on fixed rate loans and borrowings.
The instruments used for these hedges are mainly foreign currency forward contracts, interest rate swaps and
combined interest rate and foreign currency financial instruments.
The Group uses derivative financial instruments as cash flow hedges for the purpose of pre-determining:
the exchange rate at which forecasted transactions denominated in foreign currencies will be accounted for;
the interest paid on borrowings, both to match the fixed interest received on loans (customer financing activity), and
to achieve a targeted mix of floating versus fixed rate funding structured loans; and
the price of certain commodities.
The foreign currency exchange rate exposure on forecasted commercial flows is hedged by foreign currency swaps
and forward contracts. Interest rate exposures are usually hedged by interest rate swaps and, in limited cases, by
forward rate agreements. Exposure to changes in the price of commodities is generally hedged by using commodity
swaps and commodity options.
Counterparties to these agreements are major financial institutions.
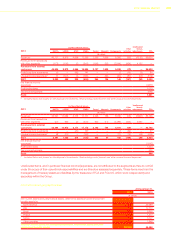
Information on the fair value of derivative financial instruments held at the balance sheet date is provided in Note 20.
The following section provides qualitative and quantitative disclosures on the effect that these risks may have. The
quantitative data reported below does not have any predictive value, in particular the sensitivity analysis on financial
market risks does not reflect the complexity of the market or the reaction which may result from any changes that are
assumed to take place.
Financial instruments held by the funds that manage pension plan assets are not included in this analysis.
Quantitative information on foreign currency exchange rate risk
The Group is exposed to risk resulting from changes in foreign currency exchange rates, which can affect its earnings
and equity. In particular:
where a Group company incurs costs in a currency different from that of its revenues, any change in exchange
rates can affect the operating results of that company. In 2014, the total trade flows exposed to foreign currency
exchange rate risk amounted to the equivalent of 15 percent of the Group’s turnover.
the principal exchange rates to which the Group is exposed are the following:
U.S. Dollar/CAD, primarily relating to FCA US’s Canadian manufacturing operations;
EUR/U.S. Dollar, relating to sales in U.S. Dollars made by Italian companies (in particular, companies belonging to
the Ferrari and Maserati segments) and to sales and purchases in Euro made by FCA US;
CNY, in relation to sales in China originating from FCA US and from Italian companies (in particular, companies
belonging to the Ferrari and Maserati segments);
GBP, AUD, MXN, CHF, ARS and VEF in relation to sales in the UK, Australian, Mexican, Swiss, Argentinean and
Venezuelan markets;
PLN and TRY, relating to manufacturing costs incurred in Poland and Turkey;
JPY mainly in relation to purchase of parts from Japanese suppliers and sales of vehicles in Japan;
U.S. Dollar/BRL, EUR/BRL, relating to Brazilian manufacturing operations and the related import and export flows.
Overall trade flows exposed to changes in these exchange rates in 2014 made up approximately 90.0 percent of
the exposure to currency risk from trade transactions.