Chrysler 2014 Annual Report Download - page 201
Download and view the complete annual report
Please find page 201 of the 2014 Chrysler annual report below. You can navigate through the pages in the report by either clicking on the pages listed below, or by using the keyword search tool below to find specific information within the annual report.-
 1
1 -
2
-
3
-
4
-
5
-
6
-
7
-
8
-
9
-
10
-
11
-
12
-
13
-
14
-
15
-
16
-
17
-
18
-
19
-
20
-
21
-
22
-
23
-
24
-
25
-
26
-
27
-
28
-
29
-
30
-
31
-
32
-
33
-
34
-
35
-
36
-
37
-
38
-
39
-
40
-
41
-
42
-
43
-
44
-
45
-
46
-
47
-
48
-
49
-
50
-
51
-
52
-
53
-
54
-
55
-
56
-
57
-
58
-
59
-
60
-
61
-
62
-
63
-
64
-
65
-
66
-
67
-
68
-
69
-
70
-
71
-
72
-
73
-
74
-
75
-
76
-
77
-
78
-
79
-
80
-
81
-
82
-
83
-
84
-
85
-
86
-
87
-
88
-
89
-
90
-
91
-
92
-
93
-
94
-
95
-
96
-
97
-
98
-
99
-
100
-
101
-
102
-
103
-
104
-
105
-
106
-
107
-
108
-
109
-
110
-
111
-
112
-
113
-
114
-
115
-
116
-
117
-
118
-
119
-
120
-
121
-
122
-
123
-
124
-
125
-
126
-
127
-
128
-
129
-
130
-
131
-
132
-
133
-
134
-
135
-
136
-
137
-
138
-
139
-
140
-
141
-
142
-
143
-
144
-
145
-
146
-
147
-
148
-
149
-
150
-
151
-
152
-
153
-
154
-
155
-
156
-
157
-
158
-
159
-
160
-
161
-
162
-
163
-
164
-
165
-
166
-
167
-
168
-
169
-
170
-
171
-
172
-
173
-
174
-
175
-
176
-
177
-
178
-
179
-
180
-
181
-
182
-
183
-
184
-
185
-
186
-
187
-
188
-
189
-
190
-
 191
191 -
 192
192 -
 193
193 -
 194
194 -
 195
195 -
 196
196 -
 197
197 -
 198
198 -
 199
199 -
 200
200 -
 201
201 -
 202
202 -
 203
203 -
 204
204 -
 205
205 -
 206
206 -
 207
207 -
 208
208 -
 209
209 -
 210
210 -
 211
211 -
212
-
213
-
214
-
215
-
216
-
217
-
218
-
219
-
220
-
221
-
222
-
223
-
224
-
225
-
226
-
227
-
228
-
229
-
230
-
231
-
232
-
233
-
234
-
235
-
236
-
237
-
238
-
239
-
240
-
241
-
242
-
243
-
244
-
245
-
246
-
247
-
248
-
249
-
250
-
251
-
252
-
253
-
254
-
255
-
256
-
257
-
258
-
259
-
260
-
261
-
262
-
263
-
264
-
265
-
266
-
267
-
268
-
269
-
270
-
271
-
272
-
273
-
274
-
275
-
276
-
277
-
278
-
279
-
280
-
281
-
282
-
283
-
284
-
285
-
286
-
287
-
288
-
289
-
290
-
291
-
292
-
293
-
294
-
295
-
296
-
297
-
298
-
299
-
300
-
301
-
302
-
303
 |
 |

2014 | ANNUAL REPORT 199
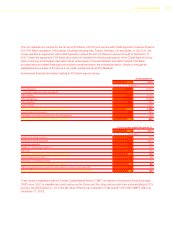
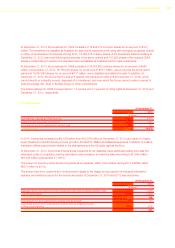
At December 31, 2014, the investment in CNHI consisted of 15,948,275 common shares for an amount of €107
million. The investment is classified as Available-for-sale and is measured at fair value with changes recognized directly
in Other comprehensive income/loss. During 2014, 18,059,375 ordinary shares of the investment balance existing at
December 31, 2013 were sold following the exercise of the stock options and 100,625 shares of the residual CNHI
shares corresponding to options not exercised were reclassified as Available-held-for-sale investments.
At December 31, 2013, the investment in CNHI consisted of 34,007,650 ordinary shares for an amount of €282
million. At December 31, 2013, 18,160,000 shares, for an amount of €151 million, were to service the stock option
plans and 15,847,650 shares, for an amount €131 million, were classified as available-for-sale. In addition, at
December 31, 2014, the Group had 15,948,275 special voting shares (33,955,402 at December 31, 2013), which
cannot directly or indirectly be sold, disposed of or transferred, and over which the Group cannot create or permit to
exist any pledge, lien, fixed or floating charge or other encumbrance.
The total investment in CNHI corresponded to 1.7 percent and 3.7 percent of voting rights at December 31, 2014 and
December 31, 2013, respectively.
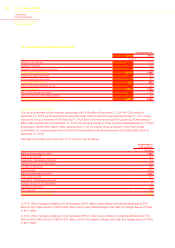
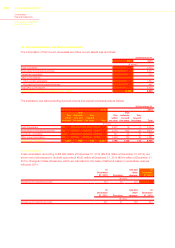
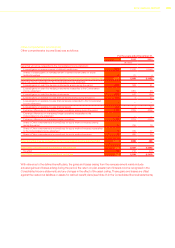
17. Inventories
At December 31,
2014 2013
(€ million)
Raw materials, supplies and finished goods 10,294 8,910
Assets sold with a buy-back commitment 2,018 1,253
Gross amount due from customers for contract work 155 115
Total Inventories 12,467 10,278
In 2014, Inventories increased by €2,189 million from €10,278 million at December 31, 2013 as a result of a higher
level of finished products following volume growth in the NAFTA, EMEA and Maserati segments in addition to positive
translation differences primarily related to the strengthening of the US dollar against the Euro.
At December 31, 2014, Inventories include those measured at net realizable value (estimated selling price less the
estimated costs of completion and the estimated costs necessary to make the sale) amounting to €1,694 million
(€1,343 million at December 31, 2013).
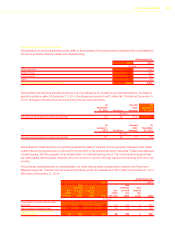
The amount of inventory write-downs recognized as an expense, within cost of sales, during 2014 is €596 million
(€571 million in 2013).
The amount due from customers for contract work relates to the design and production of industrial automation
systems and related products for the automotive sector at December 31, 2014 and 2013 was as follows:
At December 31,
2014 2013
(€ million)
Aggregate amount of costs incurred and recognized profits (less recognized losses) to date 1,817 1,506
Less: Progress billings (1,914) (1,600)
Construction contracts, net of advances on contract work (97) (94)
Gross amount due from customers for contract work as an asset 155 115
Less: Gross amount due to customers for contract work as a liability included
in Other current liabilities (252) (209)
Construction contracts, net of advances on contract work (97) (94)