Chrysler 2014 Annual Report Download - page 216
Download and view the complete annual report
Please find page 216 of the 2014 Chrysler annual report below. You can navigate through the pages in the report by either clicking on the pages listed below, or by using the keyword search tool below to find specific information within the annual report.-
 1
1 -
2
-
3
-
4
-
5
-
6
-
7
-
8
-
9
-
10
-
11
-
12
-
13
-
14
-
15
-
16
-
17
-
18
-
19
-
20
-
21
-
22
-
23
-
24
-
25
-
26
-
27
-
28
-
29
-
30
-
31
-
32
-
33
-
34
-
35
-
36
-
37
-
38
-
39
-
40
-
41
-
42
-
43
-
44
-
45
-
46
-
47
-
48
-
49
-
50
-
51
-
52
-
53
-
54
-
55
-
56
-
57
-
58
-
59
-
60
-
61
-
62
-
63
-
64
-
65
-
66
-
67
-
68
-
69
-
70
-
71
-
72
-
73
-
74
-
75
-
76
-
77
-
78
-
79
-
80
-
81
-
82
-
83
-
84
-
85
-
86
-
87
-
88
-
89
-
90
-
91
-
92
-
93
-
94
-
95
-
96
-
97
-
98
-
99
-
100
-
101
-
102
-
103
-
104
-
105
-
106
-
107
-
108
-
109
-
110
-
111
-
112
-
113
-
114
-
115
-
116
-
117
-
118
-
119
-
120
-
121
-
122
-
123
-
124
-
125
-
126
-
127
-
128
-
129
-
130
-
131
-
132
-
133
-
134
-
135
-
136
-
137
-
138
-
139
-
140
-
141
-
142
-
143
-
144
-
145
-
146
-
147
-
148
-
149
-
150
-
151
-
152
-
153
-
154
-
155
-
156
-
157
-
158
-
159
-
160
-
161
-
162
-
163
-
164
-
165
-
166
-
167
-
168
-
169
-
170
-
171
-
172
-
173
-
174
-
175
-
176
-
177
-
178
-
179
-
180
-
181
-
182
-
183
-
184
-
185
-
186
-
187
-
188
-
189
-
190
-
191
-
192
-
193
-
194
-
195
-
196
-
197
-
198
-
199
-
200
-
201
-
202
-
203
-
204
-
205
-
 206
206 -
 207
207 -
 208
208 -
 209
209 -
 210
210 -
 211
211 -
 212
212 -
 213
213 -
 214
214 -
 215
215 -
 216
216 -
 217
217 -
 218
218 -
 219
219 -
 220
220 -
 221
221 -
 222
222 -
 223
223 -
 224
224 -
 225
225 -
 226
226 -
227
-
228
-
229
-
230
-
231
-
232
-
233
-
234
-
235
-
236
-
237
-
238
-
239
-
240
-
241
-
242
-
243
-
244
-
245
-
246
-
247
-
248
-
249
-
250
-
251
-
252
-
253
-
254
-
255
-
256
-
257
-
258
-
259
-
260
-
261
-
262
-
263
-
264
-
265
-
266
-
267
-
268
-
269
-
270
-
271
-
272
-
273
-
274
-
275
-
276
-
277
-
278
-
279
-
280
-
281
-
282
-
283
-
284
-
285
-
286
-
287
-
288
-
289
-
290
-
291
-
292
-
293
-
294
-
295
-
296
-
297
-
298
-
299
-
300
-
301
-
302
-
303
 |
 |

214 2014 | ANNUAL REPORT
Consolidated
Financial Statements
Notes to the Consolidated
Financial Statements
Share-Based Compensation Plans Issued by FCA US
Four share-based compensation plans have been issued by FCA US: the FCA US Restricted Stock Unit Plan (“RSU
Plan”), the Amended and Restated FCA US Directors’ Restricted Stock Unit Plan (“Directors’ RSU Plan”), the FCA US
Deferred Phantom Share Plan (“DPS Plan”) and the FCA US 2012 Long-Term Incentive Plan (“2012 LTIP Plan”).
The fair value of each unit issued under the four share-based compensation plans is based on the fair value of FCA
US’s membership interests. Each unit represents an “FCA US Unit,” which is equal to 1/600th of the value of a FCA
US membership interest. Since there is no publicly observable trading price for FCA US membership interests, fair
value was determined using a discounted cash flow methodology. This approach, which is based on projected cash
flows of FCA US, is used to estimate the FCA US enterprise value. The fair value of FCA US’s outstanding interest
bearing debt as of the measurement date is deducted from FCA US’s enterprise value to arrive at the fair value of
equity. This amount is then divided by the total number of FCA US Units, as determined above, to estimate the fair
value of a single FCA US Unit.
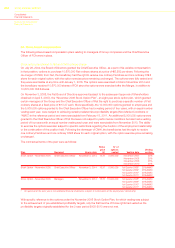
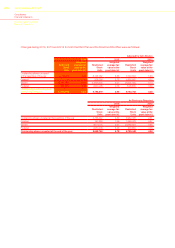
The significant assumptions used in the contemporaneous calculation of fair value at each issuance date and for each
period included the following:
four years of annual projections prepared by management that reflect the estimated after-tax cash flows a market
participant would expect to generate from operating the business;
a terminal value which was determined using a growth model that applied a 2.0 percent long-term growth rate to
projected after-tax cash flows of FCA US beyond the four year window. The long-term growth rate was based on
internal projections of FCA US, as well as industry growth prospects;
an estimated after-tax weighted average cost of capital of 16.0 percent in 2014, and ranging from 16.0 percent to
16.5 percent in both 2013 and 2012; and
projected worldwide factory shipments ranging from approximately 2.6 million vehicles in 2013 to approximately 3.4
million vehicles in 2018.
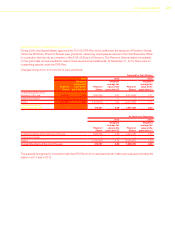
On January 21, 2014, FCA acquired the VEBA Trust’s remaining interest in FCA US, as described in the section
—Acquisition of the Remaining Ownership Interest in FCA US. The implied fair value of FCA US resulting from this
transaction, along with certain other factors, was used to corroborate the fair value determined at December 31, 2013
using a discounted cash flow methodology.
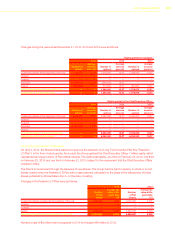
As of December 31, 2014, 29,400,000 units are authorized to be granted for the RSU Plan, Directors’ RSU Plan
and 2012 LTIP Plan. There is no limit on the number of phantom shares of FCA US (“Phantom Shares”) authorized
under the DPS Plan. Upon adoption of the 2012 LTIP Plan, there were no further grants made under the RSU Plan
and DPS Plan.
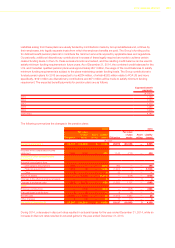
Anti-Dilution Adjustment
The documents governing FCA US’s share-based compensation plans contain anti-dilution provisions which provide
for an adjustment to the number of FCA US Units granted under the plans in order to preserve, or alternatively prevent
the enlargement of, the benefits intended to be made available to the holders of the awards should an event occur that
impacts the capital structure.
There were no capital structure changes in 2013 or 2012 that required an anti-dilution adjustment. During 2014, two
transactions occurred that diluted the fair value of equity and the per unit fair value of a FCA US Unit based on the
discounted cash flow methodology. These transactions were:
the $1,900 million (€1,404 million) distribution paid to its members, on January 21, 2014, which served to fund
a portion of the transaction whereby Fiat acquired the VEBA Trust’s remaining ownership interest in FCA US (as
described above in the section —Acquisition of the Remaining Ownership Interest in FCA US).
The prepayment of the VEBA Trust Note on February 7, 2014 that accelerated tax deductions that were being
passed through to the FCA US’s members.