Chrysler 2014 Annual Report Download - page 225
Download and view the complete annual report
Please find page 225 of the 2014 Chrysler annual report below. You can navigate through the pages in the report by either clicking on the pages listed below, or by using the keyword search tool below to find specific information within the annual report.-
 1
1 -
2
-
3
-
4
-
5
-
6
-
7
-
8
-
9
-
10
-
11
-
12
-
13
-
14
-
15
-
16
-
17
-
18
-
19
-
20
-
21
-
22
-
23
-
24
-
25
-
26
-
27
-
28
-
29
-
30
-
31
-
32
-
33
-
34
-
35
-
36
-
37
-
38
-
39
-
40
-
41
-
42
-
43
-
44
-
45
-
46
-
47
-
48
-
49
-
50
-
51
-
52
-
53
-
54
-
55
-
56
-
57
-
58
-
59
-
60
-
61
-
62
-
63
-
64
-
65
-
66
-
67
-
68
-
69
-
70
-
71
-
72
-
73
-
74
-
75
-
76
-
77
-
78
-
79
-
80
-
81
-
82
-
83
-
84
-
85
-
86
-
87
-
88
-
89
-
90
-
91
-
92
-
93
-
94
-
95
-
96
-
97
-
98
-
99
-
100
-
101
-
102
-
103
-
104
-
105
-
106
-
107
-
108
-
109
-
110
-
111
-
112
-
113
-
114
-
115
-
116
-
117
-
118
-
119
-
120
-
121
-
122
-
123
-
124
-
125
-
126
-
127
-
128
-
129
-
130
-
131
-
132
-
133
-
134
-
135
-
136
-
137
-
138
-
139
-
140
-
141
-
142
-
143
-
144
-
145
-
146
-
147
-
148
-
149
-
150
-
151
-
152
-
153
-
154
-
155
-
156
-
157
-
158
-
159
-
160
-
161
-
162
-
163
-
164
-
165
-
166
-
167
-
168
-
169
-
170
-
171
-
172
-
173
-
174
-
175
-
176
-
177
-
178
-
179
-
180
-
181
-
182
-
183
-
184
-
185
-
186
-
187
-
188
-
189
-
190
-
191
-
192
-
193
-
194
-
195
-
196
-
197
-
198
-
199
-
200
-
201
-
202
-
203
-
204
-
205
-
206
-
207
-
208
-
209
-
210
-
211
-
212
-
213
-
214
-
 215
215 -
 216
216 -
 217
217 -
 218
218 -
 219
219 -
 220
220 -
 221
221 -
 222
222 -
 223
223 -
 224
224 -
 225
225 -
 226
226 -
 227
227 -
 228
228 -
 229
229 -
 230
230 -
 231
231 -
 232
232 -
 233
233 -
 234
234 -
 235
235 -
236
-
237
-
238
-
239
-
240
-
241
-
242
-
243
-
244
-
245
-
246
-
247
-
248
-
249
-
250
-
251
-
252
-
253
-
254
-
255
-
256
-
257
-
258
-
259
-
260
-
261
-
262
-
263
-
264
-
265
-
266
-
267
-
268
-
269
-
270
-
271
-
272
-
273
-
274
-
275
-
276
-
277
-
278
-
279
-
280
-
281
-
282
-
283
-
284
-
285
-
286
-
287
-
288
-
289
-
290
-
291
-
292
-
293
-
294
-
295
-
296
-
297
-
298
-
299
-
300
-
301
-
302
-
303
 |
 |

2014 | ANNUAL REPORT 223
Non-U.S. Equity securities are invested broadly in developed international and emerging markets. Debt instruments
are fixed income securities which comprise primarily of long-term U.S. Treasury and global government bonds, as well
as U.S., developed international and emerging market companies’ debt securities diversified by sector, geography
and through a wide range of market capitalization. Commingled funds include common collective trust funds, mutual
funds and other investment entities. Private equity funds include those in limited partnerships that invest primarily
in operating companies that are not publicly traded on a stock exchange. Real estate investments includes those
in limited partnerships that invest in various commercial and residential real estate projects both domestically and
internationally. Hedge fund investments include those seeking to maximize absolute return using a broad range of
strategies to enhance returns and provide additional diversification.
The investment strategies and objectives for pension assets primarily in the U.S. and Canada reflect a balance of liability-
hedging and return-seeking investment considerations. The investment objectives are to minimize the volatility of the
value of the pension assets relative to the pension liabilities and to ensure assets are sufficient to pay plan obligations.
The objective of minimizing the volatility of assets relative to liabilities is addressed primarily through asset diversification,
partial asset–liability matching and hedging. Assets are broadly diversified across many asset classes to achieve risk–
adjusted returns that, in total, lower asset volatility relative to the liabilities. Additionally, in order to minimize pension asset
volatility relative to the pension liabilities, a portion of the pension plan assets are allocated to fixed income securities. The
Group policy for these plans ensures actual allocations are in line with target allocations as appropriate.
Assets are actively managed, primarily, by external investment managers. Investment managers are not permitted
to invest outside of the asset class or strategy for which they have been appointed. The Group uses investment
guidelines to ensure investment managers invest solely within the mandated investment strategy. Certain investment
managers use derivative financial instruments to mitigate the risk of changes in interest rates and foreign currencies
impacting the fair values of certain investments. Derivative financial instruments may also be used in place of physical
securities when it is more cost effective and/or efficient to do so. Plan assets do not include shares of FCA or
properties occupied by Group companies.
Sources of potential risk in the pension plan assets measurements relate to market risk, interest rate risk and
operating risk. Market risk is mitigated by diversification strategies and as a result, there are no significant
concentrations of risk in terms of sector, industry, geography, market capitalization, or counterparty. Interest rate
risk is mitigated by partial asset–liability matching. The fixed income target asset allocation partially matches the
bond–like and long–dated nature of the pension liabilities. Interest rate increases generally will result in a decline
in the fair value of the investments in fixed income securities and the present value of the obligations. Conversely,
interest rate decreases generally will increase the fair value of the investments in fixed income securities and the
present value of the obligations.
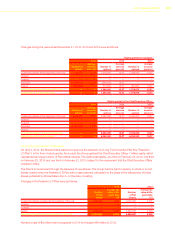
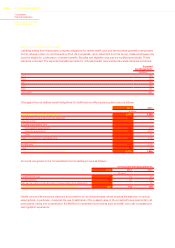
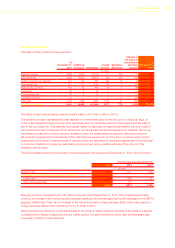
The weighted average assumptions used to determine the defined benefit obligations were as follows:
At December31,
2014 2013
U.S. Canada UK U.S. Canada UK
(%)
Discount rate 4.0 3.8 4.0 4.7 4.6 4.5
Future salary increase rate n/a 3.5 3.0 3.0 3.5 3.1
The discount rates are used in measuring the obligation and the interest expense/(income) of net period cost. The
Group selects these rates on the basis of the rate on return on high-quality (AA rated) fixed income investments for
which the timing and amounts of payments match the timing and amounts of the projected pension and other post-
employment plan. The average duration of the U.S. and Canadian liabilities was approximately 11 and 13 years,
respectively. The average duration of the UK pension liabilities was approximately 21 years.