Chrysler 2014 Annual Report Download - page 76
Download and view the complete annual report
Please find page 76 of the 2014 Chrysler annual report below. You can navigate through the pages in the report by either clicking on the pages listed below, or by using the keyword search tool below to find specific information within the annual report.-
 1
1 -
2
-
3
-
4
-
5
-
6
-
7
-
8
-
9
-
10
-
11
-
12
-
13
-
14
-
15
-
16
-
17
-
18
-
19
-
20
-
21
-
22
-
23
-
24
-
25
-
26
-
27
-
28
-
29
-
30
-
31
-
32
-
33
-
34
-
35
-
36
-
37
-
38
-
39
-
40
-
41
-
42
-
43
-
44
-
45
-
46
-
47
-
48
-
49
-
50
-
51
-
52
-
53
-
54
-
55
-
56
-
57
-
58
-
59
-
60
-
61
-
62
-
63
-
64
-
65
-
 66
66 -
 67
67 -
 68
68 -
 69
69 -
 70
70 -
 71
71 -
 72
72 -
 73
73 -
 74
74 -
 75
75 -
 76
76 -
 77
77 -
 78
78 -
 79
79 -
 80
80 -
 81
81 -
 82
82 -
 83
83 -
 84
84 -
 85
85 -
 86
86 -
87
-
88
-
89
-
90
-
91
-
92
-
93
-
94
-
95
-
96
-
97
-
98
-
99
-
100
-
101
-
102
-
103
-
104
-
105
-
106
-
107
-
108
-
109
-
110
-
111
-
112
-
113
-
114
-
115
-
116
-
117
-
118
-
119
-
120
-
121
-
122
-
123
-
124
-
125
-
126
-
127
-
128
-
129
-
130
-
131
-
132
-
133
-
134
-
135
-
136
-
137
-
138
-
139
-
140
-
141
-
142
-
143
-
144
-
145
-
146
-
147
-
148
-
149
-
150
-
151
-
152
-
153
-
154
-
155
-
156
-
157
-
158
-
159
-
160
-
161
-
162
-
163
-
164
-
165
-
166
-
167
-
168
-
169
-
170
-
171
-
172
-
173
-
174
-
175
-
176
-
177
-
178
-
179
-
180
-
181
-
182
-
183
-
184
-
185
-
186
-
187
-
188
-
189
-
190
-
191
-
192
-
193
-
194
-
195
-
196
-
197
-
198
-
199
-
200
-
201
-
202
-
203
-
204
-
205
-
206
-
207
-
208
-
209
-
210
-
211
-
212
-
213
-
214
-
215
-
216
-
217
-
218
-
219
-
220
-
221
-
222
-
223
-
224
-
225
-
226
-
227
-
228
-
229
-
230
-
231
-
232
-
233
-
234
-
235
-
236
-
237
-
238
-
239
-
240
-
241
-
242
-
243
-
244
-
245
-
246
-
247
-
248
-
249
-
250
-
251
-
252
-
253
-
254
-
255
-
256
-
257
-
258
-
259
-
260
-
261
-
262
-
263
-
264
-
265
-
266
-
267
-
268
-
269
-
270
-
271
-
272
-
273
-
274
-
275
-
276
-
277
-
278
-
279
-
280
-
281
-
282
-
283
-
284
-
285
-
286
-
287
-
288
-
289
-
290
-
291
-
292
-
293
-
294
-
295
-
296
-
297
-
298
-
299
-
300
-
301
-
302
-
303
 |
 |

74 2014 | ANNUAL REPORT
Operating Results
EBIT
2014 compared to 2013
EMEA EBIT loss for the year ended December 31, 2014 was €109 million, an improvement of €397 million, or
78.5 percent, from an EBIT loss of €506 million for the year ended December 31, 2013.
The decrease in EMEA EBIT loss was primarily attributable to the combination of (i) a €199 million decrease in other
unusual expenses, (ii) a favorable volume/mix impact of €174 million driven by the previously described increase in
shipments and improved vehicle mix, (iii) a decrease in net industrial costs of €166 million mainly driven by industrial
and purchasing efficiencies, which were partially offset by (iv) unfavorable pricing of €85 million as a result of the
competitive trading environment and resulting price pressure and (v) an increase in selling, general and administrative
costs of €67 million mainly related to advertising expenses primarily to support the growth of Jeep brand and the Jeep
Renegade launch.
In 2013, other unusual expenses were €195 million which included the write-off of previously capitalized research and
development related to new model development for Alfa Romeo products which were switched to a new platform
considered more appropriate for the brand.
2013 compared to 2012
EMEA EBIT for the year ended December 31, 2013 was a loss of €506 million, an improvement of €219 million, or
30.2 percent (31.9 percent on a constant currency basis), from a loss of €725 million for the year ended December
31, 2012.
The decrease in EMEA EBIT loss was attributable to the combined effect of (i) a decrease in selling, general and
administrative costs of €199 million as a result of the cost control measures implemented in response to the European
market weakness, including efforts to improve the focus of advertising initiatives, (ii) a decrease in industrial costs of
€139 million attributable to industrial efficiencies driven by the WCM program and purchasing savings implemented
and (iii) a positive volume and mix impact of €77 million, primarily driven by the Fiat 500 family of vehicles, the effects of
which were partially offset by (iv) unfavorable net pricing effects of €172 million, attributable to increased competitive
pressure, particularly in the first half of 2013, and (v) a decrease in the results of investments of €16 million.
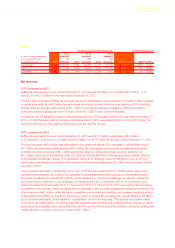
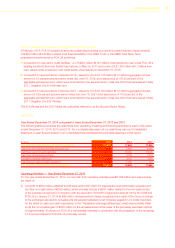
Ferrari
For the Years Ended December 31, Increase/(decrease)
(€ million, except percentages
and shipments which are in
thousands of units) 2014
% of
segment
net
revenues 2013
% of
segment
net
revenues 2012
% of
segment
net
revenues 2014 vs. 2013 2013 vs. 2012
Net revenues 2,762 100.0% 2,335 100.0% 2,225 100.0% 427 18.3% 110 4.9%
EBIT 389 14.1% 364 15.6% 335 15.1% 25 6.9% 29 8.7%
Shipments 7n.m. 7 n.m. 7 n.m. 0 0 0 0
Net Revenues
2014 compared to 2013
For the year ended December 31, 2014, Ferrari net revenues were €2.8 billion, an increase of €0.4 billion, or 18.3
percent, from €2.3 billion for the year ended December 31, 2013. The increase was primarily attributable to the
increased volumes and improved vehicle mix driven by the contribution of the LaFerrari model.
2013 compared to 2012
Ferrari net revenues for the year ended December 31, 2013 were €2.3 billion, an increase of €0.1 billion,
or 4.9 percent, from €2.2 billion for the year ended December 31, 2012. The total increase of €0.1 billion was primarily
attributable to the launch of the production and sale of engines to Maserati for use in their new vehicles in 2013.