Chrysler 2014 Annual Report Download - page 250
Download and view the complete annual report
Please find page 250 of the 2014 Chrysler annual report below. You can navigate through the pages in the report by either clicking on the pages listed below, or by using the keyword search tool below to find specific information within the annual report.-
 1
1 -
2
-
3
-
4
-
5
-
6
-
7
-
8
-
9
-
10
-
11
-
12
-
13
-
14
-
15
-
16
-
17
-
18
-
19
-
20
-
21
-
22
-
23
-
24
-
25
-
26
-
27
-
28
-
29
-
30
-
31
-
32
-
33
-
34
-
35
-
36
-
37
-
38
-
39
-
40
-
41
-
42
-
43
-
44
-
45
-
46
-
47
-
48
-
49
-
50
-
51
-
52
-
53
-
54
-
55
-
56
-
57
-
58
-
59
-
60
-
61
-
62
-
63
-
64
-
65
-
66
-
67
-
68
-
69
-
70
-
71
-
72
-
73
-
74
-
75
-
76
-
77
-
78
-
79
-
80
-
81
-
82
-
83
-
84
-
85
-
86
-
87
-
88
-
89
-
90
-
91
-
92
-
93
-
94
-
95
-
96
-
97
-
98
-
99
-
100
-
101
-
102
-
103
-
104
-
105
-
106
-
107
-
108
-
109
-
110
-
111
-
112
-
113
-
114
-
115
-
116
-
117
-
118
-
119
-
120
-
121
-
122
-
123
-
124
-
125
-
126
-
127
-
128
-
129
-
130
-
131
-
132
-
133
-
134
-
135
-
136
-
137
-
138
-
139
-
140
-
141
-
142
-
143
-
144
-
145
-
146
-
147
-
148
-
149
-
150
-
151
-
152
-
153
-
154
-
155
-
156
-
157
-
158
-
159
-
160
-
161
-
162
-
163
-
164
-
165
-
166
-
167
-
168
-
169
-
170
-
171
-
172
-
173
-
174
-
175
-
176
-
177
-
178
-
179
-
180
-
181
-
182
-
183
-
184
-
185
-
186
-
187
-
188
-
189
-
190
-
191
-
192
-
193
-
194
-
195
-
196
-
197
-
198
-
199
-
200
-
201
-
202
-
203
-
204
-
205
-
206
-
207
-
208
-
209
-
210
-
211
-
212
-
213
-
214
-
215
-
216
-
217
-
218
-
219
-
220
-
221
-
222
-
223
-
224
-
225
-
226
-
227
-
228
-
229
-
230
-
231
-
232
-
233
-
234
-
235
-
236
-
237
-
238
-
239
-
 240
240 -
 241
241 -
 242
242 -
 243
243 -
 244
244 -
 245
245 -
 246
246 -
 247
247 -
 248
248 -
 249
249 -
 250
250 -
 251
251 -
 252
252 -
 253
253 -
 254
254 -
 255
255 -
 256
256 -
 257
257 -
 258
258 -
 259
259 -
 260
260 -
261
-
262
-
263
-
264
-
265
-
266
-
267
-
268
-
269
-
270
-
271
-
272
-
273
-
274
-
275
-
276
-
277
-
278
-
279
-
280
-
281
-
282
-
283
-
284
-
285
-
286
-
287
-
288
-
289
-
290
-
291
-
292
-
293
-
294
-
295
-
296
-
297
-
298
-
299
-
300
-
301
-
302
-
303
 |
 |

248 2014 | ANNUAL REPORT
Consolidated
Financial Statements
Notes to the Consolidated
Financial Statements
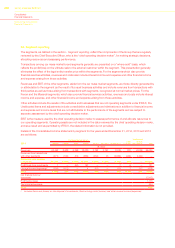
34. Segment reporting
The segments, as defined in the section - Segment reporting, reflect the components of the Group that are regularly
reviewed by the Chief Executive Officer, who is the “chief operating decision maker”, for making strategic decisions,
allocating resources and assessing performance.
Transactions among car mass-market brand segments generally are presented on a “where-sold” basis, which
reflects the profit/(loss) on the ultimate sale to the external customer within the segment. This presentation generally
eliminates the effect of the legal entity transfer price within the segments. For the segments which also provide
financial services activities, revenues and costs also include interest income and expense and other financial income
and expense arising from those activities.
Revenues and EBIT of the other segments, aside from the car mass-market segments, are those directly generated by
or attributable to the segment as the result of its usual business activities and include revenues from transactions with
third parties as well as those arising from transactions with segments, recognized at normal market prices. For the
Ferrari and the Maserati segments, which also provide financial services activities, revenues and costs include interest
income and expense, and other financial income and expense arising from those activities.
Other activities include the results of the activities and businesses that are not operating segments under IFRS 8, the
Unallocated items and adjustments include consolidation adjustments and eliminations in addition to financial income
and expense and income taxes that are not attributable to the performance of the segments and are subject to
separate assessment by the chief operating decision maker.
EBIT is the measure used by the chief operating decision maker to assess performance of and allocate resources to
our operating segments. Operating assets are not included in the data reviewed by the chief operating decision make,
and as a result and as permitted by IFRS 8, the related information is not provided.
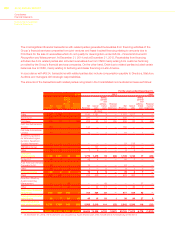
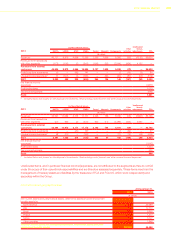
Details of the Consolidated income statement by segment for the years ended December 31, 2014, 2013 and 2012
are as follows:
Car Mass-Market brands
Ferrari Maserati Components
Other
activities
Unallocated
items &
adjustments FCA2014 NAFTA LATAM APAC EMEA
(€ million)
Revenues 52,452 8,629 6,259 18,020 2,762 2,767 8,619 831 (4,249) 96,090
Revenues from transactions
with other segments (271) (100) (10) (589) (264) (7) (2,559) (449) 4,249 —
Revenues from external
customers 52,181 8,529 6,249 17,431 2,498 2,760 6,060 382 — 96,090
Profit/(loss) from investments 1 — (50) 167 — — 7 6 — 131
Unusual income/(expenses)* (504) (112) — 4 (15) — (20) 7 212 (428)
EBIT 1,647 177 537 (109) 389 275 260 (114) 161 3,223
Net financial income/
(expenses) (2,047)
Profit before taxes 1,176
Tax (income)/expenses 544
Profit 632
(*) Includes Gains and (losses) on the disposal of investments, Restructuring costs/(income) and other unusual income/(expenses)