Chrysler 2014 Annual Report Download - page 63
Download and view the complete annual report
Please find page 63 of the 2014 Chrysler annual report below. You can navigate through the pages in the report by either clicking on the pages listed below, or by using the keyword search tool below to find specific information within the annual report.-
 1
1 -
2
-
3
-
4
-
5
-
6
-
7
-
8
-
9
-
10
-
11
-
12
-
13
-
14
-
15
-
16
-
17
-
18
-
19
-
20
-
21
-
22
-
23
-
24
-
25
-
26
-
27
-
28
-
29
-
30
-
31
-
32
-
33
-
34
-
35
-
36
-
37
-
38
-
39
-
40
-
41
-
42
-
43
-
44
-
45
-
46
-
47
-
48
-
49
-
50
-
51
-
52
-
 53
53 -
 54
54 -
 55
55 -
 56
56 -
 57
57 -
 58
58 -
 59
59 -
 60
60 -
 61
61 -
 62
62 -
 63
63 -
 64
64 -
 65
65 -
 66
66 -
 67
67 -
 68
68 -
 69
69 -
 70
70 -
 71
71 -
 72
72 -
 73
73 -
74
-
75
-
76
-
77
-
78
-
79
-
80
-
81
-
82
-
83
-
84
-
85
-
86
-
87
-
88
-
89
-
90
-
91
-
92
-
93
-
94
-
95
-
96
-
97
-
98
-
99
-
100
-
101
-
102
-
103
-
104
-
105
-
106
-
107
-
108
-
109
-
110
-
111
-
112
-
113
-
114
-
115
-
116
-
117
-
118
-
119
-
120
-
121
-
122
-
123
-
124
-
125
-
126
-
127
-
128
-
129
-
130
-
131
-
132
-
133
-
134
-
135
-
136
-
137
-
138
-
139
-
140
-
141
-
142
-
143
-
144
-
145
-
146
-
147
-
148
-
149
-
150
-
151
-
152
-
153
-
154
-
155
-
156
-
157
-
158
-
159
-
160
-
161
-
162
-
163
-
164
-
165
-
166
-
167
-
168
-
169
-
170
-
171
-
172
-
173
-
174
-
175
-
176
-
177
-
178
-
179
-
180
-
181
-
182
-
183
-
184
-
185
-
186
-
187
-
188
-
189
-
190
-
191
-
192
-
193
-
194
-
195
-
196
-
197
-
198
-
199
-
200
-
201
-
202
-
203
-
204
-
205
-
206
-
207
-
208
-
209
-
210
-
211
-
212
-
213
-
214
-
215
-
216
-
217
-
218
-
219
-
220
-
221
-
222
-
223
-
224
-
225
-
226
-
227
-
228
-
229
-
230
-
231
-
232
-
233
-
234
-
235
-
236
-
237
-
238
-
239
-
240
-
241
-
242
-
243
-
244
-
245
-
246
-
247
-
248
-
249
-
250
-
251
-
252
-
253
-
254
-
255
-
256
-
257
-
258
-
259
-
260
-
261
-
262
-
263
-
264
-
265
-
266
-
267
-
268
-
269
-
270
-
271
-
272
-
273
-
274
-
275
-
276
-
277
-
278
-
279
-
280
-
281
-
282
-
283
-
284
-
285
-
286
-
287
-
288
-
289
-
290
-
291
-
292
-
293
-
294
-
295
-
296
-
297
-
298
-
299
-
300
-
301
-
302
-
303
 |
 |

2014 | ANNUAL REPORT 61
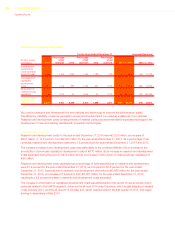
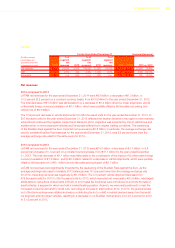
2013 compared to 2012
Research and development costs for the year ended December, 31 2013 were €2,236 million, an increase of
€378 million, or 20.3 percent, from €1,858 million for the year ended December 31, 2012. As a percentage of net
revenues, research and development costs were 2.6 percent for the year ended December 31, 2013 compared to
2.2 percent for the year ended December 31, 2012.
The increase in research and development costs was attributable to the combined effects of (i) an increase in the
amortization of capitalized development costs of €266 million and (ii) an increase in research and development costs
expensed during the year of €145 million, which were partly offset by €33 million lower write-down of costs previously
capitalized.
The increase in amortization of capitalized development costs was largely attributable to new product launches. In
particular, amortization of capitalized development in the NAFTA segment increased as a result of the 2013 launches,
including the all-new 2014 Jeep Cherokee, the Jeep Grand Cherokee and the Ram 1500. The €145 million increase
in research and development costs expensed during the year was largely attributable to increases in the NAFTA
segment, largely driven by an increase in expenses related to personnel involved in research and development
activities. In particular, at December 31, 2013 a total of 18,700 employees were dedicated to research and
development activities at Group level, compared to 17,900 at December 31, 2012.
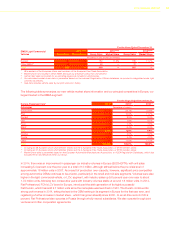
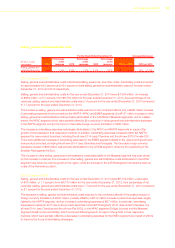
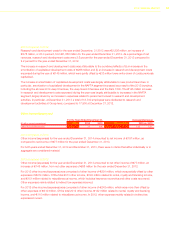
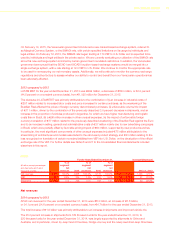
Other income/(expenses)
For the Years Ended December 31, Increase/(decrease)
(€ million, except percentages) 2014 2013 2012 2014 vs. 2013 2013 vs. 2012
Other income/(expenses) 197 77 (68) 120 155.8% 145 n.m.
2014 compared to 2013
Other income/(expenses) for the year ended December 31, 2014 amounted to net income of €197 million, as
compared to net income of €77 million for the year ended December 31, 2013.
For both years ended December 31, 2014 and December 31, 2013, there were no items that either individually or in
aggregate are considered material.
2013 compared to 2012
Other income/(expenses) for the year ended December 31, 2013 amounted to net other income of €77 million, an
increase of €145 million, from net other expenses of €68 million for the year ended December 31, 2012.
For 2013 other income/(expenses) was comprised of other income of €291 million, which was partially offset by other
expenses of €214 million. Of the total 2013 other income, €140 million related to rental, royalty and licensing income,
and €151 million related to miscellaneous income, which includes insurance recoveries and other costs recovered.
Other expenses mainly related to indirect tax expenses incurred.
For 2012 other income/(expenses) was comprised of other income of €242 million, which was more than offset by
other expenses of €310 million. Of the total 2012 other income, €132 million related to rental, royalty and licensing
income, and €110 million related to miscellaneous income. In 2012, other expenses mainly related to indirect tax
expenses incurred.