Chrysler 2014 Annual Report Download - page 52
Download and view the complete annual report
Please find page 52 of the 2014 Chrysler annual report below. You can navigate through the pages in the report by either clicking on the pages listed below, or by using the keyword search tool below to find specific information within the annual report.-
 1
1 -
2
-
3
-
4
-
5
-
6
-
7
-
8
-
9
-
10
-
11
-
12
-
13
-
14
-
15
-
16
-
17
-
18
-
19
-
20
-
21
-
22
-
23
-
24
-
25
-
26
-
27
-
28
-
29
-
30
-
31
-
32
-
33
-
34
-
35
-
36
-
37
-
38
-
39
-
40
-
41
-
 42
42 -
 43
43 -
 44
44 -
 45
45 -
 46
46 -
 47
47 -
 48
48 -
 49
49 -
 50
50 -
 51
51 -
 52
52 -
 53
53 -
 54
54 -
 55
55 -
 56
56 -
 57
57 -
 58
58 -
 59
59 -
 60
60 -
 61
61 -
 62
62 -
63
-
64
-
65
-
66
-
67
-
68
-
69
-
70
-
71
-
72
-
73
-
74
-
75
-
76
-
77
-
78
-
79
-
80
-
81
-
82
-
83
-
84
-
85
-
86
-
87
-
88
-
89
-
90
-
91
-
92
-
93
-
94
-
95
-
96
-
97
-
98
-
99
-
100
-
101
-
102
-
103
-
104
-
105
-
106
-
107
-
108
-
109
-
110
-
111
-
112
-
113
-
114
-
115
-
116
-
117
-
118
-
119
-
120
-
121
-
122
-
123
-
124
-
125
-
126
-
127
-
128
-
129
-
130
-
131
-
132
-
133
-
134
-
135
-
136
-
137
-
138
-
139
-
140
-
141
-
142
-
143
-
144
-
145
-
146
-
147
-
148
-
149
-
150
-
151
-
152
-
153
-
154
-
155
-
156
-
157
-
158
-
159
-
160
-
161
-
162
-
163
-
164
-
165
-
166
-
167
-
168
-
169
-
170
-
171
-
172
-
173
-
174
-
175
-
176
-
177
-
178
-
179
-
180
-
181
-
182
-
183
-
184
-
185
-
186
-
187
-
188
-
189
-
190
-
191
-
192
-
193
-
194
-
195
-
196
-
197
-
198
-
199
-
200
-
201
-
202
-
203
-
204
-
205
-
206
-
207
-
208
-
209
-
210
-
211
-
212
-
213
-
214
-
215
-
216
-
217
-
218
-
219
-
220
-
221
-
222
-
223
-
224
-
225
-
226
-
227
-
228
-
229
-
230
-
231
-
232
-
233
-
234
-
235
-
236
-
237
-
238
-
239
-
240
-
241
-
242
-
243
-
244
-
245
-
246
-
247
-
248
-
249
-
250
-
251
-
252
-
253
-
254
-
255
-
256
-
257
-
258
-
259
-
260
-
261
-
262
-
263
-
264
-
265
-
266
-
267
-
268
-
269
-
270
-
271
-
272
-
273
-
274
-
275
-
276
-
277
-
278
-
279
-
280
-
281
-
282
-
283
-
284
-
285
-
286
-
287
-
288
-
289
-
290
-
291
-
292
-
293
-
294
-
295
-
296
-
297
-
298
-
299
-
300
-
301
-
302
-
303
 |
 |

50 2014 | ANNUAL REPORT
Overview of Our Business
We sell a range of vehicles in the APAC segment, including small and compact cars and utility vehicles.
Although our smallest mass-market segment by vehicle sales, we believe the APAC segment represents a significant
growth opportunity and we have invested in building relationships with key joint venture partners in China and India in
order to increase our presence in the region. In 2010, the demand for mid-size vehicles in China led us to begin a joint
venture with Guangzhou Automobile Group Co. for the production of Fiat brand passenger cars. Currently the Fiat Ottimo
and Fiat Viaggio, along with our other Fiat-branded vehicles imported from Europe and North America, are distributed
through the joint venture’s local dealer network in that country. In addition, in 2014, we and GAC group announced that
together we will produce Jeep and Chrysler branded vehicles in China. We also work with a joint venture partner in India
to manufacture Fiat branded vehicles that we distribute through our wholly-owned subsidiary. In other parts of the APAC
segment, we distribute vehicles that we manufacture in the U.S. and Europe through our dealers and distributors.
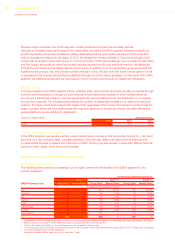
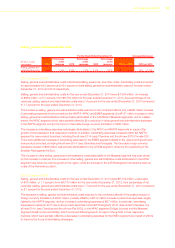
APAC Distribution
In the key markets in the APAC segment (China, Australia, India, Japan and South Korea), we sell our vehicles through
a wholly-owned subsidiary or through our joint ventures to local independent dealers. In other markets where we
do not have a substantial presence, we have agreements with general distributors for the distribution of our vehicles
through their networks. The following table presents the number of independent entities in our dealer and distributor
network. The table counts each independent dealer entity, regardless of the number of contracts or points of sale the
dealer operates. Where we have relationships with a general distributor in a particular market, this table reflects that
general distributor as one distribution relationship:
Distribution Relationships At December 31,
2014 2013 2012
APAC 729 671 470
APAC Dealer and Customer Financing
In the APAC segment, we operate a wholly-owned captive finance company, Fiat Automotive Finance Co., Ltd, which
supports, on a non-exclusive basis, our sales activities in China through dealer and retail customer financing and
provides similar services to dealers and customers of CNHI. Vendor programs are also in place with different financial
partners in India, Japan, South Korea and Australia.
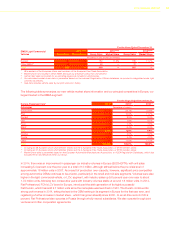
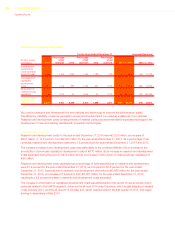
EMEA Vehicle Sales, Competition and Distribution
EMEA Sales and Competition
The following table presents our passenger car and light commercial vehicle sales in the EMEA segment for the
periods presented:
For the Years Ended December 31,
2014(1)(2)(3) 2013(1)(2)(3) 2012(1)(2)(3)
EMEA Passenger Cars Group Sales Market Share Group Sales Market Share Group Sales Market Share
Thousands of units (except percentages)
Italy 377 27.7% 374 28.7% 415 29.6%
Germany 84 2.8% 80 2.7% 90 2.9%
UK 80 3.2% 72 3.2% 64 3.1%
France 62 3.5% 62 3.5% 62 3.3%
Spain 36 4.3% 27 3.7% 23 3.3%
Other Europe 121 3.5% 123 3.7% 141 4.1%
Europe* 760 5.8% 738 6.0% 795 6.3%
Other EMEA** 126 — 137 — 122 —
Total 886 — 875 — 917 —
* 28 members of the European Union and members of the European Free Trade Association (other than Italy, Germany, UK, France, and Spain).
** Market share not included in Other EMEA because our presence is less than one percent.
(1) Certain fleet sales accounted for as operating leases are included in vehicle sales.
(2) Our estimated market share data is presented based on the European Automobile Manufacturers Association (ACEA) Registration Databases
and national Registration Offices databases.
(3) Sale data includes vehicle sales by our joint venture in Turkey.