Chrysler 2014 Annual Report Download - page 119
Download and view the complete annual report
Please find page 119 of the 2014 Chrysler annual report below. You can navigate through the pages in the report by either clicking on the pages listed below, or by using the keyword search tool below to find specific information within the annual report.-
 1
1 -
2
-
3
-
4
-
5
-
6
-
7
-
8
-
9
-
10
-
11
-
12
-
13
-
14
-
15
-
16
-
17
-
18
-
19
-
20
-
21
-
22
-
23
-
24
-
25
-
26
-
27
-
28
-
29
-
30
-
31
-
32
-
33
-
34
-
35
-
36
-
37
-
38
-
39
-
40
-
41
-
42
-
43
-
44
-
45
-
46
-
47
-
48
-
49
-
50
-
51
-
52
-
53
-
54
-
55
-
56
-
57
-
58
-
59
-
60
-
61
-
62
-
63
-
64
-
65
-
66
-
67
-
68
-
69
-
70
-
71
-
72
-
73
-
74
-
75
-
76
-
77
-
78
-
79
-
80
-
81
-
82
-
83
-
84
-
85
-
86
-
87
-
88
-
89
-
90
-
91
-
92
-
93
-
94
-
95
-
96
-
97
-
98
-
99
-
100
-
101
-
102
-
103
-
104
-
105
-
106
-
107
-
108
-
 109
109 -
 110
110 -
 111
111 -
 112
112 -
 113
113 -
 114
114 -
 115
115 -
 116
116 -
 117
117 -
 118
118 -
 119
119 -
 120
120 -
 121
121 -
 122
122 -
 123
123 -
 124
124 -
 125
125 -
 126
126 -
 127
127 -
 128
128 -
 129
129 -
130
-
131
-
132
-
133
-
134
-
135
-
136
-
137
-
138
-
139
-
140
-
141
-
142
-
143
-
144
-
145
-
146
-
147
-
148
-
149
-
150
-
151
-
152
-
153
-
154
-
155
-
156
-
157
-
158
-
159
-
160
-
161
-
162
-
163
-
164
-
165
-
166
-
167
-
168
-
169
-
170
-
171
-
172
-
173
-
174
-
175
-
176
-
177
-
178
-
179
-
180
-
181
-
182
-
183
-
184
-
185
-
186
-
187
-
188
-
189
-
190
-
191
-
192
-
193
-
194
-
195
-
196
-
197
-
198
-
199
-
200
-
201
-
202
-
203
-
204
-
205
-
206
-
207
-
208
-
209
-
210
-
211
-
212
-
213
-
214
-
215
-
216
-
217
-
218
-
219
-
220
-
221
-
222
-
223
-
224
-
225
-
226
-
227
-
228
-
229
-
230
-
231
-
232
-
233
-
234
-
235
-
236
-
237
-
238
-
239
-
240
-
241
-
242
-
243
-
244
-
245
-
246
-
247
-
248
-
249
-
250
-
251
-
252
-
253
-
254
-
255
-
256
-
257
-
258
-
259
-
260
-
261
-
262
-
263
-
264
-
265
-
266
-
267
-
268
-
269
-
270
-
271
-
272
-
273
-
274
-
275
-
276
-
277
-
278
-
279
-
280
-
281
-
282
-
283
-
284
-
285
-
286
-
287
-
288
-
289
-
290
-
291
-
292
-
293
-
294
-
295
-
296
-
297
-
298
-
299
-
300
-
301
-
302
-
303
 |
 |

2014 | ANNUAL REPORT 117
CRF draws on technical skills and knowledge covering the full spectrum of automotive engineering disciplines and is
equipped with state-of-the-art laboratories for testing powertrain systems, analyzing materials and electromagnetic
compatibility, and conducting noise and vibration analysis and driving simulations. All research activities are conducted
in coordination with the technical areas and operating regions of FCA.
Located in Windsor, Canada, the FCA Automotive Research and Development Centre (ARDC) opened in May 1996
in partnership with the University of Windsor and serves as an illustration of what can be achieved when industry,
academia and government work together. The ARDC is equipped with six road-test simulators and a range of
research and development support facilities, including the Automotive Coatings Research Facility, the Automotive
Lighting Research Facility and the Vehicle Recycling Laboratory.
Dedication to innovation in numbers (no.) 2014
CRF employees at year end 914
Collaborative research projects, running at the end of 2014 264
of which: approved in 2014 17
Strategy to Minimize Emissions
The Group’s sustainable product strategy is based on reducing the environmental impact of vehicles over their entire
life cycle and addressing emissions challenges on several fronts. Key elements in this strategy include optimizing the
efficiency of conventional engines, offering a full range of alternative fuel vehicles, developing alternative propulsion and
emission reduction systems, reducing the energy requirements of vehicles, promoting driver behavior that contributes
to reducing emissions and introducing new mobility services and solutions.
Immediate and tangible results can best be achieved by combining conventional and alternative technologies,
while recognizing and accommodating the different economic, geographic and fuel requirements of each market.
Affordability is also a key consideration: even the most effective technologies cannot have a significant impact on the
environment if they are too expensive to reach a sufficiently large number of people.
The Group’s commitment to increasingly sustainable mobility is particularly focused on the EMEA and NAFTA regions,
where approximately 73% of Group revenues were generated in 2014.
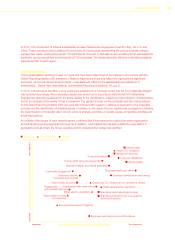
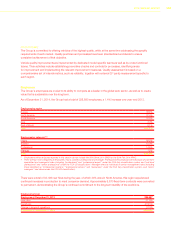
In the European Union, the Group’s Mass-Market brands (Fiat, Alfa Romeo, Lancia, Abarth, Chrysler and Jeep) have
reduced average CO2 emissions per vehicle sold by 24% over the past 14 years. In addition, approximately 73% of
Group cars sold in 2014 had CO2 emissions at or below 120 g/km, and 82% at or below 130 g/km.
New registrations by CO2 emissions level in European Union for Mass-Market Brands (g/km)(*)
up to 100 12%
from 101 to 110 15%
from 111 to 120 46%
from 121 to 130 9%
above 130 18%
Total 100%
(*) CO2 data based on New European Driving Cycle (NEDC) measurement standard.
In the United States, vehicle efficiency is measured by fuel economy (Data is reported to the U.S. National Highway
Traffic Safety Administration (NHTSA) and provided by model year, meaning the year used to designate a discrete
vehicle model, irrespective of the calendar year in which the vehicle was actually produced, provided that the
production period does not exceed 24 months. CAFE standards from NHTSA are set independently for passenger
cars and light duty trucks. Fuel economy is based on the most recent NHTSA required submission, which for 2014
reflects mid-model year data. Previous year data is adjusted to reflect final EPA/NHTSA reports) expressed in miles
per gallon (mpg). Actual fleet performance is dependent on many factors, including the vehicles and technologies FCA
offers, as well as the mix of vehicles consumers choose to buy.