Chrysler 2014 Annual Report Download - page 251
Download and view the complete annual report
Please find page 251 of the 2014 Chrysler annual report below. You can navigate through the pages in the report by either clicking on the pages listed below, or by using the keyword search tool below to find specific information within the annual report.-
 1
1 -
2
-
3
-
4
-
5
-
6
-
7
-
8
-
9
-
10
-
11
-
12
-
13
-
14
-
15
-
16
-
17
-
18
-
19
-
20
-
21
-
22
-
23
-
24
-
25
-
26
-
27
-
28
-
29
-
30
-
31
-
32
-
33
-
34
-
35
-
36
-
37
-
38
-
39
-
40
-
41
-
42
-
43
-
44
-
45
-
46
-
47
-
48
-
49
-
50
-
51
-
52
-
53
-
54
-
55
-
56
-
57
-
58
-
59
-
60
-
61
-
62
-
63
-
64
-
65
-
66
-
67
-
68
-
69
-
70
-
71
-
72
-
73
-
74
-
75
-
76
-
77
-
78
-
79
-
80
-
81
-
82
-
83
-
84
-
85
-
86
-
87
-
88
-
89
-
90
-
91
-
92
-
93
-
94
-
95
-
96
-
97
-
98
-
99
-
100
-
101
-
102
-
103
-
104
-
105
-
106
-
107
-
108
-
109
-
110
-
111
-
112
-
113
-
114
-
115
-
116
-
117
-
118
-
119
-
120
-
121
-
122
-
123
-
124
-
125
-
126
-
127
-
128
-
129
-
130
-
131
-
132
-
133
-
134
-
135
-
136
-
137
-
138
-
139
-
140
-
141
-
142
-
143
-
144
-
145
-
146
-
147
-
148
-
149
-
150
-
151
-
152
-
153
-
154
-
155
-
156
-
157
-
158
-
159
-
160
-
161
-
162
-
163
-
164
-
165
-
166
-
167
-
168
-
169
-
170
-
171
-
172
-
173
-
174
-
175
-
176
-
177
-
178
-
179
-
180
-
181
-
182
-
183
-
184
-
185
-
186
-
187
-
188
-
189
-
190
-
191
-
192
-
193
-
194
-
195
-
196
-
197
-
198
-
199
-
200
-
201
-
202
-
203
-
204
-
205
-
206
-
207
-
208
-
209
-
210
-
211
-
212
-
213
-
214
-
215
-
216
-
217
-
218
-
219
-
220
-
221
-
222
-
223
-
224
-
225
-
226
-
227
-
228
-
229
-
230
-
231
-
232
-
233
-
234
-
235
-
236
-
237
-
238
-
239
-
240
-
 241
241 -
 242
242 -
 243
243 -
 244
244 -
 245
245 -
 246
246 -
 247
247 -
 248
248 -
 249
249 -
 250
250 -
 251
251 -
 252
252 -
 253
253 -
 254
254 -
 255
255 -
 256
256 -
 257
257 -
 258
258 -
 259
259 -
 260
260 -
 261
261 -
262
-
263
-
264
-
265
-
266
-
267
-
268
-
269
-
270
-
271
-
272
-
273
-
274
-
275
-
276
-
277
-
278
-
279
-
280
-
281
-
282
-
283
-
284
-
285
-
286
-
287
-
288
-
289
-
290
-
291
-
292
-
293
-
294
-
295
-
296
-
297
-
298
-
299
-
300
-
301
-
302
-
303
 |
 |

2014 | ANNUAL REPORT 249
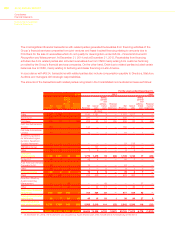
Car Mass-Market brands
Ferrari Maserati Components
Other
activities
Unallocated
items &
adjustments FCA2013 NAFTA LATAM APAC EMEA
(€ million)
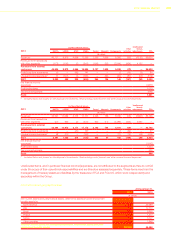
Revenues 45,777 9,973 4,668 17,335 2,335 1,659 8,080 929 (4,132) 86,624
Revenues from transactions
with other segments (173) (100) (2) (641) (198) (20) (2,544) (454) 4,132 —
Revenues from external
customers 45,604 9,873 4,666 16,694 2,137 1,639 5,536 475 — 86,624
Profit/(loss) from investments (1) — (46) 141 — — 5 (13) (2) 84
Unusual income/(expenses)* 71 (127) (1) (195) — (65) (60) (87) (55) (519)
EBIT 2,290 492 335 (506) 364 106 146 (167) (58) 3,002
Net financial income/
(expenses) (1,987)
Profit before taxes 1,015
Tax (income)/expenses (936)
Profit 1,951
(*) Includes Gains and (losses) on the disposal of investments, Restructuring costs/(income) and other unusual income/(expenses)
Car Mass-Market brands
Ferrari Maserati Components
Other
activities
Unallocated
items &
adjustments FCA2012 NAFTA LATAM APAC EMEA
(€ million)
Revenues 43,521 11,062 3,173 17,717 2,225 755 8,030 979 (3,697) 83,765
Revenues from transactions
with other segments (27) (89) (2) (544) (82) (11) (2,489) (453) 3,697 —
Revenues from external
customers 43,494 10,973 3,171 17,173 2,143 744 5,541 526 — 83,765
Profit/(loss) from investments ——(20) 157 — — 2 (52) — 87
Unusual income/(expenses)* 48 (31) —(194) — — (11) (12) (44) (244)
EBIT 2,491 1,025 274 (725) 335 57 165 (149) (39) 3,434
Net financial income/
(expenses) (1,910)
Profit before taxes 1,524
Tax (income)/expenses 628
Profit 896
(*) Includes Gains and (losses) on the disposal of investments, Restructuring costs/(income) and other unusual income/(expenses)
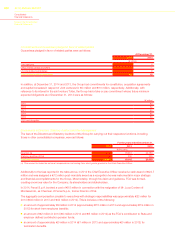
Unallocated items, and in particular financial income/(expenses), are not attributed to the segments as they do not fall
under the scope of their operational responsibilities and are therefore assessed separately. These items arise from the
management of treasury assets and liabilities by the treasuries of FCA and FCA US, which work independently and
separately within the Group.
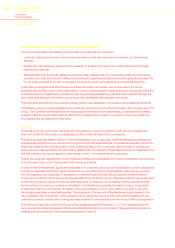
Information about geographical area
At December 31,
2014 2013
(€ million)
Non-current assets (excluding financial assets, deferred tax assets and post-employment
benefits assets) in:
North America 30,539 26,689
Italy 11,538 10,710
Brazil 4,638 2,955
Poland 1,183 1,277
Serbia 882 1,007
Other countries 2,129 1,848
Total Non-current assets (excluding financial assets, deferred tax assets and post-
employment benefits assets) 50,909 44,486