Chrysler 2014 Annual Report Download - page 72
Download and view the complete annual report
Please find page 72 of the 2014 Chrysler annual report below. You can navigate through the pages in the report by either clicking on the pages listed below, or by using the keyword search tool below to find specific information within the annual report.-
 1
1 -
2
-
3
-
4
-
5
-
6
-
7
-
8
-
9
-
10
-
11
-
12
-
13
-
14
-
15
-
16
-
17
-
18
-
19
-
20
-
21
-
22
-
23
-
24
-
25
-
26
-
27
-
28
-
29
-
30
-
31
-
32
-
33
-
34
-
35
-
36
-
37
-
38
-
39
-
40
-
41
-
42
-
43
-
44
-
45
-
46
-
47
-
48
-
49
-
50
-
51
-
52
-
53
-
54
-
55
-
56
-
57
-
58
-
59
-
60
-
61
-
 62
62 -
 63
63 -
 64
64 -
 65
65 -
 66
66 -
 67
67 -
 68
68 -
 69
69 -
 70
70 -
 71
71 -
 72
72 -
 73
73 -
 74
74 -
 75
75 -
 76
76 -
 77
77 -
 78
78 -
 79
79 -
 80
80 -
 81
81 -
 82
82 -
83
-
84
-
85
-
86
-
87
-
88
-
89
-
90
-
91
-
92
-
93
-
94
-
95
-
96
-
97
-
98
-
99
-
100
-
101
-
102
-
103
-
104
-
105
-
106
-
107
-
108
-
109
-
110
-
111
-
112
-
113
-
114
-
115
-
116
-
117
-
118
-
119
-
120
-
121
-
122
-
123
-
124
-
125
-
126
-
127
-
128
-
129
-
130
-
131
-
132
-
133
-
134
-
135
-
136
-
137
-
138
-
139
-
140
-
141
-
142
-
143
-
144
-
145
-
146
-
147
-
148
-
149
-
150
-
151
-
152
-
153
-
154
-
155
-
156
-
157
-
158
-
159
-
160
-
161
-
162
-
163
-
164
-
165
-
166
-
167
-
168
-
169
-
170
-
171
-
172
-
173
-
174
-
175
-
176
-
177
-
178
-
179
-
180
-
181
-
182
-
183
-
184
-
185
-
186
-
187
-
188
-
189
-
190
-
191
-
192
-
193
-
194
-
195
-
196
-
197
-
198
-
199
-
200
-
201
-
202
-
203
-
204
-
205
-
206
-
207
-
208
-
209
-
210
-
211
-
212
-
213
-
214
-
215
-
216
-
217
-
218
-
219
-
220
-
221
-
222
-
223
-
224
-
225
-
226
-
227
-
228
-
229
-
230
-
231
-
232
-
233
-
234
-
235
-
236
-
237
-
238
-
239
-
240
-
241
-
242
-
243
-
244
-
245
-
246
-
247
-
248
-
249
-
250
-
251
-
252
-
253
-
254
-
255
-
256
-
257
-
258
-
259
-
260
-
261
-
262
-
263
-
264
-
265
-
266
-
267
-
268
-
269
-
270
-
271
-
272
-
273
-
274
-
275
-
276
-
277
-
278
-
279
-
280
-
281
-
282
-
283
-
284
-
285
-
286
-
287
-
288
-
289
-
290
-
291
-
292
-
293
-
294
-
295
-
296
-
297
-
298
-
299
-
300
-
301
-
302
-
303
 |
 |

70 2014 | ANNUAL REPORT
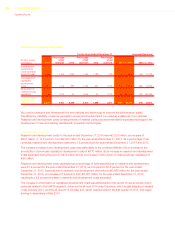
Operating Results
EBIT
2014 compared to 2013
LATAM EBIT for the year ended December 31, 2014 was €177 million, a decrease of €315 million, or 64.0 percent
(53.7 percent on a constant currency basis), from €492 million for the year ended December 31, 2013.
The decrease in LATAM EBIT was primarily attributable to the combination of (i) unfavorable volume/mix impact
of €228 million attributable to a decrease in shipments, partially offset by an improvement in vehicle mix in Brazil,
(ii) an increase in industrial costs of €441 million largely attributable to price increases for certain foreign currency
denominated purchases, which were impacted by the weakening of the Brazilian Real, (iii) the impact of unfavorable
foreign currency translation of €51 million attributable to the weakening of the Brazilian Real against the Euro, partially
offset by (v) favorable pricing of €381 million driven by pricing actions in Brazil and Argentina.
In particular, LATAM net other unusual expenses amounted to €112 million for the year ended December 31, 2014,
which included €98 million for the remeasurement charge on the Venezuelan subsidiary’s net monetary assets,
compared to €127 million for the year ended December 31, 2013 which included €75 million attributable to the
streamlining of architectures and models associated to the refocused product strategy and €43 million relating to the
loss recognized on translation of certain monetary liabilities from VEF into U.S. Dollar.
During the year ended December 31, 2014, the economic conditions in Venezuela declined due to high inflation, the
downward trend in the price of oil which began during the fourth quarter of 2014, and continued uncertainty regarding
liquidity within the country and the availability of U.S. Dollar. In addition, the Venezuelan government enacted a law in
January 2014 which provided limits on costs, sales prices and profit margins (30 percent maximum above structured
costs) across the Venezuelan economy. There remains uncertainty as to the application of certain aspects of this law
by the Venezuelan government; therefore, we are unable to assess its impact on our vehicle, parts and accessory
sales. Despite the negative economic conditions in Venezuela, we continued to obtain cash to support future
operations through the SICAD I auctions and were also able to complete our workforce reduction initiative.
As of December 31, 2014, we continue to control and therefore consolidate our Venezuelan operations. We will
continue to assess conditions in Venezuela and if in the future, we conclude that we no longer maintain control over
our operations in Venezuela, we may incur a pre-tax charge of approximately €247 million using the current exchange
rate of 12.0 VEF to U.S. Dollar.
Based on first quarter 2014 developments related to the foreign exchange process in Venezuela, we changed the
exchange rate used to remeasure our Venezuelan subsidiary’s net monetary assets in U.S. Dollar. The official exchange
rate was increasingly reserved only for purchases of those goods and services deemed “essential” by the Venezuelan
government. As of March 31, 2014, we began to use the exchange rate determined by an auction process conducted by
Venezuela’s Supplementary Foreign Currency Administration System, referred to as the SICAD I rate.
In late March 2014, the Venezuelan government introduced an additional auction-based foreign exchange system,
referred to as SICAD II rate. Prior to the new exchange system described below, the SICAD II rate had ranged from
49 to 52.1VEF to U.S. Dollar in the period since its introduction. The SICAD II rate was expected to be used primarily
for imports and has been limited to amounts of VEF that could be exchanged into other currencies, such as the
U.S. Dollar. As a result of the March 2014 exchange agreement between the Central Bank of Venezuela and the
Venezuelan government and the limitations of the SICAD II rate, we believed at December 31, 2014, that any future
remittances of dividends would be transacted at the SICAD I rate. As a result, we determined that the SICAD I rate is
the most appropriate rate to use as of December 31, 2014.
As of December 31, 2014 and 2013, the net monetary assets of FCA Venezuela LLC, formerly known as Chrysler de
Venezuela LLC, or FCA Venezuela, denominated in VEF were 783 million (€54 million) and 2,221 million
(€255 million), respectively, which included cash and cash equivalents denominated in VEF of 1,785 million
(€123 million) and 2,347 million (€270 million), respectively. Based on our net monetary assets at December 31, 2014,
a charge of approximately €5 million would result for every 10.0 percent devaluation of the VEF.