Chrysler 2014 Annual Report Download - page 186
Download and view the complete annual report
Please find page 186 of the 2014 Chrysler annual report below. You can navigate through the pages in the report by either clicking on the pages listed below, or by using the keyword search tool below to find specific information within the annual report.-
 1
1 -
2
-
3
-
4
-
5
-
6
-
7
-
8
-
9
-
10
-
11
-
12
-
13
-
14
-
15
-
16
-
17
-
18
-
19
-
20
-
21
-
22
-
23
-
24
-
25
-
26
-
27
-
28
-
29
-
30
-
31
-
32
-
33
-
34
-
35
-
36
-
37
-
38
-
39
-
40
-
41
-
42
-
43
-
44
-
45
-
46
-
47
-
48
-
49
-
50
-
51
-
52
-
53
-
54
-
55
-
56
-
57
-
58
-
59
-
60
-
61
-
62
-
63
-
64
-
65
-
66
-
67
-
68
-
69
-
70
-
71
-
72
-
73
-
74
-
75
-
76
-
77
-
78
-
79
-
80
-
81
-
82
-
83
-
84
-
85
-
86
-
87
-
88
-
89
-
90
-
91
-
92
-
93
-
94
-
95
-
96
-
97
-
98
-
99
-
100
-
101
-
102
-
103
-
104
-
105
-
106
-
107
-
108
-
109
-
110
-
111
-
112
-
113
-
114
-
115
-
116
-
117
-
118
-
119
-
120
-
121
-
122
-
123
-
124
-
125
-
126
-
127
-
128
-
129
-
130
-
131
-
132
-
133
-
134
-
135
-
136
-
137
-
138
-
139
-
140
-
141
-
142
-
143
-
144
-
145
-
146
-
147
-
148
-
149
-
150
-
151
-
152
-
153
-
154
-
155
-
156
-
157
-
158
-
159
-
160
-
161
-
162
-
163
-
164
-
165
-
166
-
167
-
168
-
169
-
170
-
171
-
172
-
173
-
174
-
175
-
 176
176 -
 177
177 -
 178
178 -
 179
179 -
 180
180 -
 181
181 -
 182
182 -
 183
183 -
 184
184 -
 185
185 -
 186
186 -
 187
187 -
 188
188 -
 189
189 -
 190
190 -
 191
191 -
 192
192 -
 193
193 -
 194
194 -
 195
195 -
 196
196 -
197
-
198
-
199
-
200
-
201
-
202
-
203
-
204
-
205
-
206
-
207
-
208
-
209
-
210
-
211
-
212
-
213
-
214
-
215
-
216
-
217
-
218
-
219
-
220
-
221
-
222
-
223
-
224
-
225
-
226
-
227
-
228
-
229
-
230
-
231
-
232
-
233
-
234
-
235
-
236
-
237
-
238
-
239
-
240
-
241
-
242
-
243
-
244
-
245
-
246
-
247
-
248
-
249
-
250
-
251
-
252
-
253
-
254
-
255
-
256
-
257
-
258
-
259
-
260
-
261
-
262
-
263
-
264
-
265
-
266
-
267
-
268
-
269
-
270
-
271
-
272
-
273
-
274
-
275
-
276
-
277
-
278
-
279
-
280
-
281
-
282
-
283
-
284
-
285
-
286
-
287
-
288
-
289
-
290
-
291
-
292
-
293
-
294
-
295
-
296
-
297
-
298
-
299
-
300
-
301
-
302
-
303
 |
 |

184 2014 | ANNUAL REPORT
Consolidated
Financial Statements
Notes to the Consolidated
Financial Statements
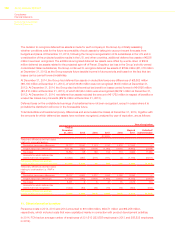
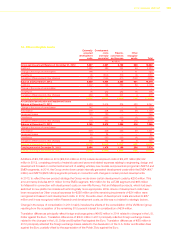
9. Net financial income/(expenses)
The following table sets out details of the Group’s financial income and expenses, including the amounts reported in
the Consolidated income statement within the Financial income/(expenses) line item, as well as interest income from
financial services activities, recognized under Net revenues, and Interest cost and other financial charges from financial
services companies, recognized under Cost of sales.
For the years ended December 31,
2014 2013 2012
Financial income: (€ million)
Interest income and other financial income: 226 201 266
Interest income from banks deposits 170 153 180
Interest income from securities 78 14
Other interest income and financial income 49 40 72
Interest income of financial services activities 275 239 277
Gains on disposal of securities 34 2
Total Financial income 504 444 545
Total Financial income relating to:
Industrial companies (A) 229 205 268
Financial services companies (reported within Net revenues) 275 239 277
Financial expenses:
Interest expense and other financial expenses: 1,916 1,904 1,973
Interest expenses on bonds 1,204 959 921
Interest expenses on bank borrowing 427 367 382
Commission expenses 21 25 21
Other interest cost and financial expenses 264 553 649
Write-downs of financial assets 84 105 50
Losses on disposal of securities 63 9
Net interest expenses on employee benefits provisions 330 371 388
Total Financial expenses 2,336 2,383 2,420
Net expenses/(income) from derivative financial instruments and
exchange rate differences 110 (1) (84)
Total Financial expenses and net expenses from derivative financial
instruments and exchange rate differences 2,446 2,382 2,336
Total Financial expenses and net expenses from derivative financial
instruments and exchange rate differences relating to:
Industrial companies (B) 2,276 2,192 2,178
Financial services companies (reported with Cost of sales) 170 190 158
Net financial income expenses relating to industrial companies (A - B) 2,047 1,987 1,910
Other interest cost and financial expenses includes interest expenses of €33 million (€326 million in 2013 and €342
million in 2012) related to the VEBA Trust Note and interest expenses of €50 million (€61 million in 2013 and €71
million in 2012) related to the Canadian Health Care Trust Note.
Net income/(expenses) from derivative financial instruments and exchange rate differences include net income of €31
million in 2013 and net income of €34 million in 2012 arising from the equity swaps on FCA and CNH Industrial N.V.
(“CNHI”) shares relating to certain stock option plans. These equity swaps expired in 2013.