Chrysler 2014 Annual Report Download - page 265
Download and view the complete annual report
Please find page 265 of the 2014 Chrysler annual report below. You can navigate through the pages in the report by either clicking on the pages listed below, or by using the keyword search tool below to find specific information within the annual report.-
 1
1 -
2
-
3
-
4
-
5
-
6
-
7
-
8
-
9
-
10
-
11
-
12
-
13
-
14
-
15
-
16
-
17
-
18
-
19
-
20
-
21
-
22
-
23
-
24
-
25
-
26
-
27
-
28
-
29
-
30
-
31
-
32
-
33
-
34
-
35
-
36
-
37
-
38
-
39
-
40
-
41
-
42
-
43
-
44
-
45
-
46
-
47
-
48
-
49
-
50
-
51
-
52
-
53
-
54
-
55
-
56
-
57
-
58
-
59
-
60
-
61
-
62
-
63
-
64
-
65
-
66
-
67
-
68
-
69
-
70
-
71
-
72
-
73
-
74
-
75
-
76
-
77
-
78
-
79
-
80
-
81
-
82
-
83
-
84
-
85
-
86
-
87
-
88
-
89
-
90
-
91
-
92
-
93
-
94
-
95
-
96
-
97
-
98
-
99
-
100
-
101
-
102
-
103
-
104
-
105
-
106
-
107
-
108
-
109
-
110
-
111
-
112
-
113
-
114
-
115
-
116
-
117
-
118
-
119
-
120
-
121
-
122
-
123
-
124
-
125
-
126
-
127
-
128
-
129
-
130
-
131
-
132
-
133
-
134
-
135
-
136
-
137
-
138
-
139
-
140
-
141
-
142
-
143
-
144
-
145
-
146
-
147
-
148
-
149
-
150
-
151
-
152
-
153
-
154
-
155
-
156
-
157
-
158
-
159
-
160
-
161
-
162
-
163
-
164
-
165
-
166
-
167
-
168
-
169
-
170
-
171
-
172
-
173
-
174
-
175
-
176
-
177
-
178
-
179
-
180
-
181
-
182
-
183
-
184
-
185
-
186
-
187
-
188
-
189
-
190
-
191
-
192
-
193
-
194
-
195
-
196
-
197
-
198
-
199
-
200
-
201
-
202
-
203
-
204
-
205
-
206
-
207
-
208
-
209
-
210
-
211
-
212
-
213
-
214
-
215
-
216
-
217
-
218
-
219
-
220
-
221
-
222
-
223
-
224
-
225
-
226
-
227
-
228
-
229
-
230
-
231
-
232
-
233
-
234
-
235
-
236
-
237
-
238
-
239
-
240
-
241
-
242
-
243
-
244
-
245
-
246
-
247
-
248
-
249
-
250
-
251
-
252
-
253
-
254
-
 255
255 -
 256
256 -
 257
257 -
 258
258 -
 259
259 -
 260
260 -
 261
261 -
 262
262 -
 263
263 -
 264
264 -
 265
265 -
 266
266 -
 267
267 -
 268
268 -
 269
269 -
 270
270 -
 271
271 -
 272
272 -
 273
273 -
 274
274 -
 275
275 -
276
-
277
-
278
-
279
-
280
-
281
-
282
-
283
-
284
-
285
-
286
-
287
-
288
-
289
-
290
-
291
-
292
-
293
-
294
-
295
-
296
-
297
-
298
-
299
-
300
-
301
-
302
-
303
 |
 |
2014 | ANNUAL REPORT 263
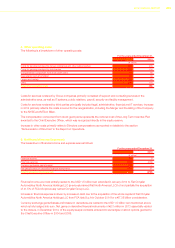
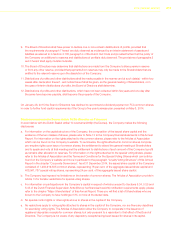
4. Other operating costs
The following is a breakdown of other operating costs:
For the years ended December 31,
2014 2013
(€ million)
Costs for services rendered by Group companies and other related parties (25) (25)
Costs for services rendered by third parties (34) (24)
Compensation component from stock grant plans (2) (6)
Depreciation and amortization (2) (2)
Leases and rentals (3) (4)
Other (66) (11)
Total other operating costs (132) (72)
Costs for services rendered by Group companies primarily consisted of support and consulting services in the
administrative area, as well as IT systems, public relations, payroll, security and facility management.
Costs for services rendered by third parties principally included legal, administrative, financial and IT services. Increase
in 2014 primarily reflects the costs incurred for the reorganization, including the Merger and the listing of the Company
to the NYSE and MTA in Milan.
The compensation component from stock grant plans represents the notional cost of the Long Term Incentive Plan
awarded to the Chief Executive Officer, which was recognized directly in the equity reserve.
Increase in other costs primarily refers to Directors compensations as reported in details into the section
“Remuneration of Directors” in the Report on Operations.
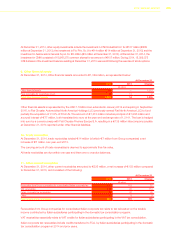
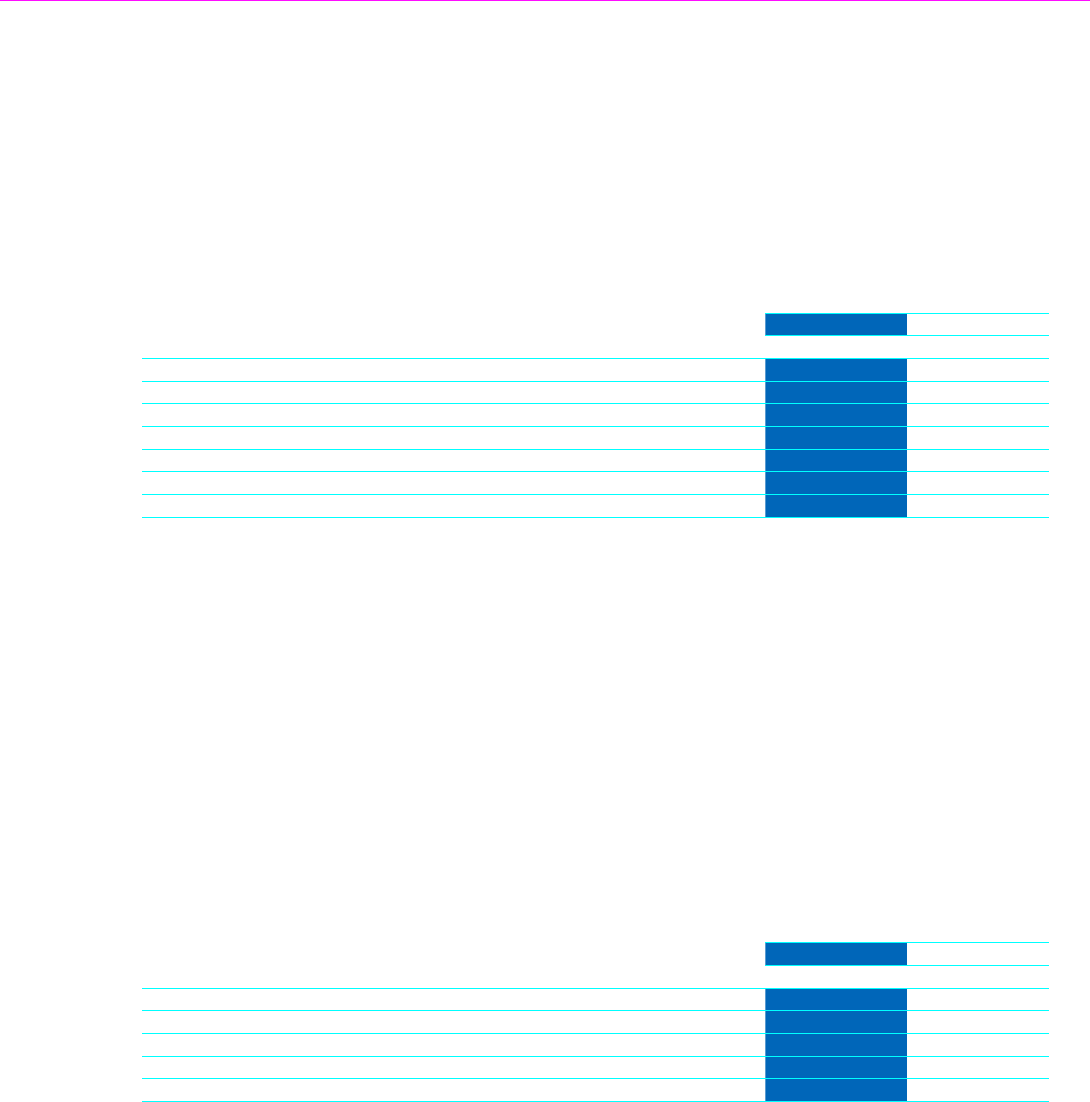
5. Net financial income/(expenses)
The breakdown of financial income and expense was as follows:
For the years ended December 31,
2014 2013
(€ million)
Financial income 85 8
Financial expense (564) (249)
Currency exchange gains/(losses) 143 —
Net gains/(losses) on derivative financial instruments (139) 31
Total financial income/(expense) (475) (210)
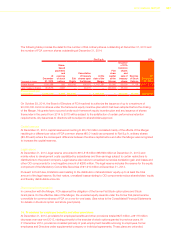
Financial income are most entirely related to the USD 1.5 billion loan extended in January 2014 to Fiat Chrysler
Automobiles North America Holdings LLC (previously named Fiat North America LLC) to fund partially the acquisition
of 41.5% of FCA US (previously named Chrysler Group LLC).
Increase in financial expense is driven by increase in debt due to the acquisition of the whole capital of Fiat Chrysler
Automobiles North America Holdings LLC from FCA Italy S.p.A in October 2014 for a €7.25 billion consideration.
Currency exchange gains/(losses) and losses on derivatives are related to the USD 1.5 billion loan mentioned above
which is fully hedged into euro. Net gains on derivative financial instruments of €31 million in 2013 essentially related
to the closure, in December 2013, of the equity swaps contracts entered into as hedges on stock options granted to
the Chief Executive Officer in 2004 and 2006.