Chrysler 2014 Annual Report Download - page 69
Download and view the complete annual report
Please find page 69 of the 2014 Chrysler annual report below. You can navigate through the pages in the report by either clicking on the pages listed below, or by using the keyword search tool below to find specific information within the annual report.-
 1
1 -
2
-
3
-
4
-
5
-
6
-
7
-
8
-
9
-
10
-
11
-
12
-
13
-
14
-
15
-
16
-
17
-
18
-
19
-
20
-
21
-
22
-
23
-
24
-
25
-
26
-
27
-
28
-
29
-
30
-
31
-
32
-
33
-
34
-
35
-
36
-
37
-
38
-
39
-
40
-
41
-
42
-
43
-
44
-
45
-
46
-
47
-
48
-
49
-
50
-
51
-
52
-
53
-
54
-
55
-
56
-
57
-
58
-
 59
59 -
 60
60 -
 61
61 -
 62
62 -
 63
63 -
 64
64 -
 65
65 -
 66
66 -
 67
67 -
 68
68 -
 69
69 -
 70
70 -
 71
71 -
 72
72 -
 73
73 -
 74
74 -
 75
75 -
 76
76 -
 77
77 -
 78
78 -
 79
79 -
80
-
81
-
82
-
83
-
84
-
85
-
86
-
87
-
88
-
89
-
90
-
91
-
92
-
93
-
94
-
95
-
96
-
97
-
98
-
99
-
100
-
101
-
102
-
103
-
104
-
105
-
106
-
107
-
108
-
109
-
110
-
111
-
112
-
113
-
114
-
115
-
116
-
117
-
118
-
119
-
120
-
121
-
122
-
123
-
124
-
125
-
126
-
127
-
128
-
129
-
130
-
131
-
132
-
133
-
134
-
135
-
136
-
137
-
138
-
139
-
140
-
141
-
142
-
143
-
144
-
145
-
146
-
147
-
148
-
149
-
150
-
151
-
152
-
153
-
154
-
155
-
156
-
157
-
158
-
159
-
160
-
161
-
162
-
163
-
164
-
165
-
166
-
167
-
168
-
169
-
170
-
171
-
172
-
173
-
174
-
175
-
176
-
177
-
178
-
179
-
180
-
181
-
182
-
183
-
184
-
185
-
186
-
187
-
188
-
189
-
190
-
191
-
192
-
193
-
194
-
195
-
196
-
197
-
198
-
199
-
200
-
201
-
202
-
203
-
204
-
205
-
206
-
207
-
208
-
209
-
210
-
211
-
212
-
213
-
214
-
215
-
216
-
217
-
218
-
219
-
220
-
221
-
222
-
223
-
224
-
225
-
226
-
227
-
228
-
229
-
230
-
231
-
232
-
233
-
234
-
235
-
236
-
237
-
238
-
239
-
240
-
241
-
242
-
243
-
244
-
245
-
246
-
247
-
248
-
249
-
250
-
251
-
252
-
253
-
254
-
255
-
256
-
257
-
258
-
259
-
260
-
261
-
262
-
263
-
264
-
265
-
266
-
267
-
268
-
269
-
270
-
271
-
272
-
273
-
274
-
275
-
276
-
277
-
278
-
279
-
280
-
281
-
282
-
283
-
284
-
285
-
286
-
287
-
288
-
289
-
290
-
291
-
292
-
293
-
294
-
295
-
296
-
297
-
298
-
299
-
300
-
301
-
302
-
303
 |
 |

2014 | ANNUAL REPORT 67
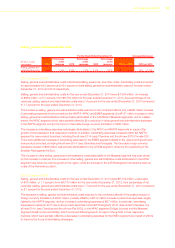
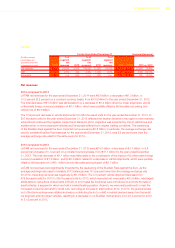
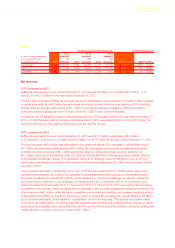
Net revenues
2014 compared to 2013
NAFTA net revenues for the year ended December 31, 2014 were €52.5 billion, an increase of €6.7 billion, or
14.6 percent, from €45.8 billion for the year ended December 31, 2013. The total increase of €6.7 billion was
primarily attributable to (i) an increase in shipments of €4.4 billion, (ii) favorable market and vehicle mix of €1.9 billion
and (iii) favorable net pricing of €0.4 billion.
The 11.4 percent increase in vehicle shipments from 2,238 thousand units for the year ended December 31, 2013, to
2,493 thousand units for the year ended December 31, 2014, was largely driven by increased demand of the Group’s
vehicles, including the all-new 2014 Jeep Cherokee, Ram pickups and the Jeep Grand Cherokee. These increases
were partially offset by a reduction in the prior model year Chrysler 200 and Dodge Avenger shipments due to their
discontinued production in the first quarter of 2014 in preparation for the launch and changeover to the all-new 2015
Chrysler 200, which began arriving in dealerships in May 2014.
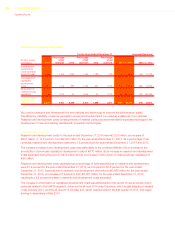
Of the favorable mix impact of €1.9 billion, €1.7 billion related to vehicle mix due to higher proportion of trucks and
certain SUVs as compared to passenger cars (as these larger vehicles generally have a higher selling price), and
€0.2 billion related to a shift in distribution channel mix to greater retail shipments as a percentage of total shipments,
which is consistent with the continuing strategy to grow U.S. retail market share while maintaining stable fleet shipments.
Favorable net pricing of €0.4 billion reflected favorable pricing and pricing for enhanced content, partially offset by
incentive spending on certain vehicles in portfolio.
2013 compared to 2012
NAFTA net revenues for the year ended December 31, 2013 were €45.8 billion, an increase of €2.3 billion,
or 5.2 percent (8.7 percent on a constant currency basis), from €43.5 billion for the year ended December 31, 2012.
The total increase of €2.3 billion was mainly attributable to the combination of (i) an increase in shipments of €1.5
billion, (ii) favorable market and vehicle mix of €1.2 billion and (iii) favorable vehicle pricing of €0.9 billion, which were
partially offset by (iv) unfavorable foreign currency impact of €1.5 billion.
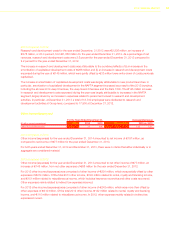
The 5.8 percent increase in vehicle shipments from 2,115 thousand vehicles for the year ended December 31, 2012
to 2,238 thousand vehicles for the year ended December 31, 2013, was primarily driven by increased demand for our
products, as evidenced by the increase in market share, from 11.3 percent for the year ended December 31, 2012 to
11.5 percent for the year ended December 31, 2013. The increase in shipments was supported by the launch of the
Ram 1500 in late 2012 and the all-new 2014 Jeep Cherokee, the effects of which were partially offset by a decrease in
Jeep Liberty shipments following its discontinued production during 2012. Of the favorable mix impact of €1.2 billion,
€0.9 billion was related to the increase of shipments of trucks and certain SUVs, as compared to passenger cars
(as trucks generally have a higher selling price), while a shift in the distribution channel mix towards higher priced retail
shipments and away from fleet shipments resulted in an increase in net revenues of €0.3 billion. Our ability to increase
sales price of current year models to reflect enhancements made resulted in an increase in net revenues of €0.9
billion. These increases were partially offset by the impact of the weakening of the U.S. Dollar against the Euro during
2013, which amounted to €1.5 billion.