Chrysler 2014 Annual Report Download - page 221
Download and view the complete annual report
Please find page 221 of the 2014 Chrysler annual report below. You can navigate through the pages in the report by either clicking on the pages listed below, or by using the keyword search tool below to find specific information within the annual report.-
 1
1 -
2
-
3
-
4
-
5
-
6
-
7
-
8
-
9
-
10
-
11
-
12
-
13
-
14
-
15
-
16
-
17
-
18
-
19
-
20
-
21
-
22
-
23
-
24
-
25
-
26
-
27
-
28
-
29
-
30
-
31
-
32
-
33
-
34
-
35
-
36
-
37
-
38
-
39
-
40
-
41
-
42
-
43
-
44
-
45
-
46
-
47
-
48
-
49
-
50
-
51
-
52
-
53
-
54
-
55
-
56
-
57
-
58
-
59
-
60
-
61
-
62
-
63
-
64
-
65
-
66
-
67
-
68
-
69
-
70
-
71
-
72
-
73
-
74
-
75
-
76
-
77
-
78
-
79
-
80
-
81
-
82
-
83
-
84
-
85
-
86
-
87
-
88
-
89
-
90
-
91
-
92
-
93
-
94
-
95
-
96
-
97
-
98
-
99
-
100
-
101
-
102
-
103
-
104
-
105
-
106
-
107
-
108
-
109
-
110
-
111
-
112
-
113
-
114
-
115
-
116
-
117
-
118
-
119
-
120
-
121
-
122
-
123
-
124
-
125
-
126
-
127
-
128
-
129
-
130
-
131
-
132
-
133
-
134
-
135
-
136
-
137
-
138
-
139
-
140
-
141
-
142
-
143
-
144
-
145
-
146
-
147
-
148
-
149
-
150
-
151
-
152
-
153
-
154
-
155
-
156
-
157
-
158
-
159
-
160
-
161
-
162
-
163
-
164
-
165
-
166
-
167
-
168
-
169
-
170
-
171
-
172
-
173
-
174
-
175
-
176
-
177
-
178
-
179
-
180
-
181
-
182
-
183
-
184
-
185
-
186
-
187
-
188
-
189
-
190
-
191
-
192
-
193
-
194
-
195
-
196
-
197
-
198
-
199
-
200
-
201
-
202
-
203
-
204
-
205
-
206
-
207
-
208
-
209
-
210
-
 211
211 -
 212
212 -
 213
213 -
 214
214 -
 215
215 -
 216
216 -
 217
217 -
 218
218 -
 219
219 -
 220
220 -
 221
221 -
 222
222 -
 223
223 -
 224
224 -
 225
225 -
 226
226 -
 227
227 -
 228
228 -
 229
229 -
 230
230 -
 231
231 -
232
-
233
-
234
-
235
-
236
-
237
-
238
-
239
-
240
-
241
-
242
-
243
-
244
-
245
-
246
-
247
-
248
-
249
-
250
-
251
-
252
-
253
-
254
-
255
-
256
-
257
-
258
-
259
-
260
-
261
-
262
-
263
-
264
-
265
-
266
-
267
-
268
-
269
-
270
-
271
-
272
-
273
-
274
-
275
-
276
-
277
-
278
-
279
-
280
-
281
-
282
-
283
-
284
-
285
-
286
-
287
-
288
-
289
-
290
-
291
-
292
-
293
-
294
-
295
-
296
-
297
-
298
-
299
-
300
-
301
-
302
-
303
 |
 |

2014 | ANNUAL REPORT 219
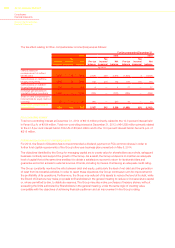
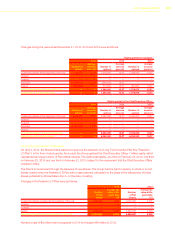
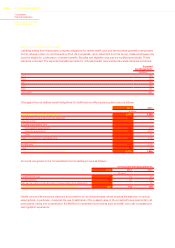
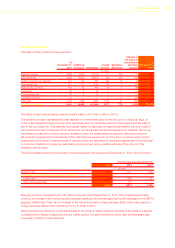
Changes during 2014, 2013 and 2012 were as follows:
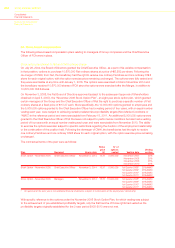
As Previously Reported
December 31, 2013
LTIP RSUs
Weighted
average fair
value at the
grant date (€) LTIP PSUs
Weighted
average fair
value at the
grant date (€)
Outstanding shares unvested at the beginning of the year 1,805,123 5.78 8,419,684 5.78
Granted 1,628,822 6.89 587,091 7.15
Vested (615,315) 5.77 — —
Forfeited (120,423) 6.20 (589,264) 5.77
Outstanding shares unvested at the end of the year 2,698,207 6.13 8,417,511 5.64
As Previously Reported
December 31, 2012
LTIP RSUs
Weighted
average fair
value at the
grant date (€) LTIP PSUs
Weighted
average fair
value at the
grant date (€)
Outstanding shares unvested at the beginning of the year — — — —
Granted 1,835,833 5.73 8,450,275 5.73
Vested (20,123) 5.91 — —
Forfeited (10,587) 5.91 (30,591) 5.91
Outstanding shares unvested at the end of the year 1,805,123 5.78 8,419,684 5.78
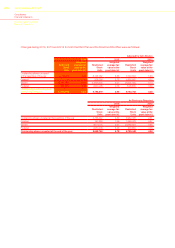
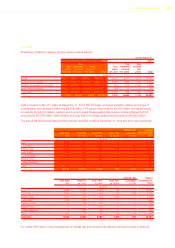
Adjusted for Anti-Dilution
2014 2013 2012
LTIP RSUs
Weighted
average fair
value at the
grant date (€)LTIP RSUs
Weighted
average fair
value at the
grant date (€) LTIP RSUs
Weighted
average fair
value at the
grant date (€)
Outstanding shares unvested at
the beginning of the year 3,500,654 4.73 2,341,967 4.46 — —
Granted — — 2,113,234 5.32 2,381,810 4.41
Vested (1,407,574) 4.81 (798,310) 4.45 (26,108) 4.56
Forfeited (104,020) 4.91 (156,237) 4.78 (13,735) 4.56
Outstanding shares unvested
at the end of the year 1,989,060 5.41 3,500,654 4.73 2,341,967 4.46
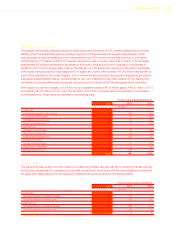
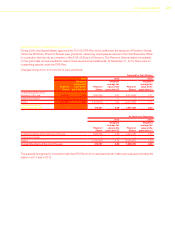
Adjusted for Anti-Dilution
2014 2013 2012
LTIP PSUs
Weighted
average fair
value at the
grant date (€)LTIP PSUs
Weighted
average fair
value at the
grant date (€) LTIP PSUs
Weighted
average fair
value at the
grant date (€)
Outstanding shares unvested at
the beginning of the year 8,417,511 5.64 8,419,684 5.78 — —
Granted 5,556,503 7.62 587,091 7.15 8,450,275 5.73
Vested — — ————
Forfeited (8,653,474) 5.89 (589,264) 5.77 (30,591) 5.91
Outstanding shares unvested
at the end of the year 5,320,540 8.62 8,417,511 5.64 8,419,684 5.78
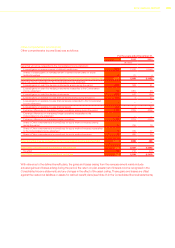
The expense recognized in connection with these plans in 2014 was €6 million (€36 million in 2013 and €24 million
in 2012). Total unrecognized compensation expenses at December 31, 2014 were approximately €2 million. These
expenses will be recognized over the remaining service periods based upon the assessment of the performance
conditions being achieved.