Chrysler 2014 Annual Report Download - page 47
Download and view the complete annual report
Please find page 47 of the 2014 Chrysler annual report below. You can navigate through the pages in the report by either clicking on the pages listed below, or by using the keyword search tool below to find specific information within the annual report.-
 1
1 -
2
-
3
-
4
-
5
-
6
-
7
-
8
-
9
-
10
-
11
-
12
-
13
-
14
-
15
-
16
-
17
-
18
-
19
-
20
-
21
-
22
-
23
-
24
-
25
-
26
-
27
-
28
-
29
-
30
-
31
-
32
-
33
-
34
-
35
-
36
-
 37
37 -
 38
38 -
 39
39 -
 40
40 -
 41
41 -
 42
42 -
 43
43 -
 44
44 -
 45
45 -
 46
46 -
 47
47 -
 48
48 -
 49
49 -
 50
50 -
 51
51 -
 52
52 -
 53
53 -
 54
54 -
 55
55 -
 56
56 -
 57
57 -
58
-
59
-
60
-
61
-
62
-
63
-
64
-
65
-
66
-
67
-
68
-
69
-
70
-
71
-
72
-
73
-
74
-
75
-
76
-
77
-
78
-
79
-
80
-
81
-
82
-
83
-
84
-
85
-
86
-
87
-
88
-
89
-
90
-
91
-
92
-
93
-
94
-
95
-
96
-
97
-
98
-
99
-
100
-
101
-
102
-
103
-
104
-
105
-
106
-
107
-
108
-
109
-
110
-
111
-
112
-
113
-
114
-
115
-
116
-
117
-
118
-
119
-
120
-
121
-
122
-
123
-
124
-
125
-
126
-
127
-
128
-
129
-
130
-
131
-
132
-
133
-
134
-
135
-
136
-
137
-
138
-
139
-
140
-
141
-
142
-
143
-
144
-
145
-
146
-
147
-
148
-
149
-
150
-
151
-
152
-
153
-
154
-
155
-
156
-
157
-
158
-
159
-
160
-
161
-
162
-
163
-
164
-
165
-
166
-
167
-
168
-
169
-
170
-
171
-
172
-
173
-
174
-
175
-
176
-
177
-
178
-
179
-
180
-
181
-
182
-
183
-
184
-
185
-
186
-
187
-
188
-
189
-
190
-
191
-
192
-
193
-
194
-
195
-
196
-
197
-
198
-
199
-
200
-
201
-
202
-
203
-
204
-
205
-
206
-
207
-
208
-
209
-
210
-
211
-
212
-
213
-
214
-
215
-
216
-
217
-
218
-
219
-
220
-
221
-
222
-
223
-
224
-
225
-
226
-
227
-
228
-
229
-
230
-
231
-
232
-
233
-
234
-
235
-
236
-
237
-
238
-
239
-
240
-
241
-
242
-
243
-
244
-
245
-
246
-
247
-
248
-
249
-
250
-
251
-
252
-
253
-
254
-
255
-
256
-
257
-
258
-
259
-
260
-
261
-
262
-
263
-
264
-
265
-
266
-
267
-
268
-
269
-
270
-
271
-
272
-
273
-
274
-
275
-
276
-
277
-
278
-
279
-
280
-
281
-
282
-
283
-
284
-
285
-
286
-
287
-
288
-
289
-
290
-
291
-
292
-
293
-
294
-
295
-
296
-
297
-
298
-
299
-
300
-
301
-
302
-
303
 |
 |

2014 | ANNUAL REPORT 45
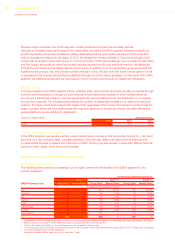
Vehicle Sales Overview
We are the seventh largest automotive OEM in the world based on worldwide new vehicle sales for the year ended
December 31, 2014. We compete with other large OEMs to attract vehicle sales and market share. Many of these
OEMs have more significant financial or operating resources and liquidity at their disposal, which may enable them to
invest more heavily on new product designs and manufacturing or in sales incentives.
Our new vehicle sales represent sales of vehicles primarily through dealers and distributors, or in some cases, directly
by us, to retail customers and fleet customers. Our sales include mass-market and luxury vehicles manufactured at our
plants, as well as vehicles manufactured by our joint ventures and third party contract manufacturers. Our sales figures
exclude sales of vehicles that we contract manufactured for other OEMs. While our vehicle sales are illustrative of our
competitive position and the demand for our vehicles, sales are not directly correlated to our revenues, cost of sales or
other measures of financial performance, as such results are primarily driven by our vehicle shipments to dealers and
distributors. The following table shows our new vehicle sales by geographic market for the periods presented.
For the Years Ended December 31,
Segment 2014 2013 2012
Millions of units
NAFTA 2.5 2.1 2.0
LATAM 0.8 0.9 1.0
APAC 0.3 0.2 0.1
EMEA 1.2 1.1 1.2
Total Mass-Market Brands 4.8 4.4 4.3
Ferrari —— —
Maserati 0.04 0.02 0.01
Total Worldwide 4.8 4.4 4.3
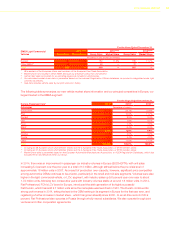
NAFTA
NAFTA Sales and Competition
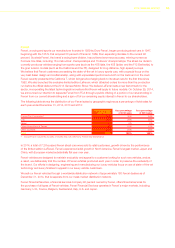
The following table presents our mass-market vehicle sales and market share in the NAFTA segment for the periods
presented:
For the Years Ended December 31,
2014(1)(2) 2013(1)(2) 2012(1)(2)
NAFTA Group Sales Market Share Group Sales Market Share Group Sales Market Share
Thousands of units (except percentages)
U.S. 2,091 12.4% 1,800 11.4% 1,652 11.2%
Canada 290 15.4% 260 14.6% 244 14.2%
Mexico 78 6.7% 87 7.9% 93 9.1%
Total 2,459 12.4% 2,148 11.5% 1,989 11.3%
(1) Certain fleet sales that are accounted for as operating leases are included in vehicle sales.
(2) Our estimated market share data presented are based on management’s estimates of industry sales data, which use certain data provided by
third-party sources, including IHS Global Insight and Ward’s Automotive.