Chrysler 2014 Annual Report Download - page 77
Download and view the complete annual report
Please find page 77 of the 2014 Chrysler annual report below. You can navigate through the pages in the report by either clicking on the pages listed below, or by using the keyword search tool below to find specific information within the annual report.-
 1
1 -
2
-
3
-
4
-
5
-
6
-
7
-
8
-
9
-
10
-
11
-
12
-
13
-
14
-
15
-
16
-
17
-
18
-
19
-
20
-
21
-
22
-
23
-
24
-
25
-
26
-
27
-
28
-
29
-
30
-
31
-
32
-
33
-
34
-
35
-
36
-
37
-
38
-
39
-
40
-
41
-
42
-
43
-
44
-
45
-
46
-
47
-
48
-
49
-
50
-
51
-
52
-
53
-
54
-
55
-
56
-
57
-
58
-
59
-
60
-
61
-
62
-
63
-
64
-
65
-
66
-
 67
67 -
 68
68 -
 69
69 -
 70
70 -
 71
71 -
 72
72 -
 73
73 -
 74
74 -
 75
75 -
 76
76 -
 77
77 -
 78
78 -
 79
79 -
 80
80 -
 81
81 -
 82
82 -
 83
83 -
 84
84 -
 85
85 -
 86
86 -
 87
87 -
88
-
89
-
90
-
91
-
92
-
93
-
94
-
95
-
96
-
97
-
98
-
99
-
100
-
101
-
102
-
103
-
104
-
105
-
106
-
107
-
108
-
109
-
110
-
111
-
112
-
113
-
114
-
115
-
116
-
117
-
118
-
119
-
120
-
121
-
122
-
123
-
124
-
125
-
126
-
127
-
128
-
129
-
130
-
131
-
132
-
133
-
134
-
135
-
136
-
137
-
138
-
139
-
140
-
141
-
142
-
143
-
144
-
145
-
146
-
147
-
148
-
149
-
150
-
151
-
152
-
153
-
154
-
155
-
156
-
157
-
158
-
159
-
160
-
161
-
162
-
163
-
164
-
165
-
166
-
167
-
168
-
169
-
170
-
171
-
172
-
173
-
174
-
175
-
176
-
177
-
178
-
179
-
180
-
181
-
182
-
183
-
184
-
185
-
186
-
187
-
188
-
189
-
190
-
191
-
192
-
193
-
194
-
195
-
196
-
197
-
198
-
199
-
200
-
201
-
202
-
203
-
204
-
205
-
206
-
207
-
208
-
209
-
210
-
211
-
212
-
213
-
214
-
215
-
216
-
217
-
218
-
219
-
220
-
221
-
222
-
223
-
224
-
225
-
226
-
227
-
228
-
229
-
230
-
231
-
232
-
233
-
234
-
235
-
236
-
237
-
238
-
239
-
240
-
241
-
242
-
243
-
244
-
245
-
246
-
247
-
248
-
249
-
250
-
251
-
252
-
253
-
254
-
255
-
256
-
257
-
258
-
259
-
260
-
261
-
262
-
263
-
264
-
265
-
266
-
267
-
268
-
269
-
270
-
271
-
272
-
273
-
274
-
275
-
276
-
277
-
278
-
279
-
280
-
281
-
282
-
283
-
284
-
285
-
286
-
287
-
288
-
289
-
290
-
291
-
292
-
293
-
294
-
295
-
296
-
297
-
298
-
299
-
300
-
301
-
302
-
303
 |
 |
2014 | ANNUAL REPORT 75
EBIT
2014 compared to 2013
Ferrari EBIT for the year ended December 31, 2014, was €389 million, an increase of €25 million, or 6.9 percent
from €364 million for the year ended December 31, 2013. For 2014 EBIT includes an unusual charge of €15 million
in compensation cost related to the resignation of the former chairman. Increase in EBIT was attributable to higher
volumes and improved sales mix largely driven by the contribution of the LaFerrari model.
2013 compared to 2012
Ferrari EBIT for 2013 was €364 million, an increase of €29 million, or 8.7 percent, from €335 million for 2012,
attributable to favorable vehicle mix and an increase in the contribution from licensing activities and revenues from the
personalization of vehicles.
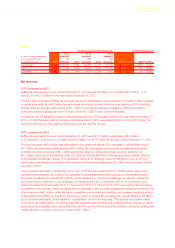
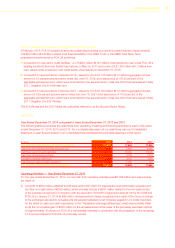
Maserati
For the Years Ended December 31, Increase/(decrease)
(€ million, except percentages
and shipments which are in
thousands of units) 2014
% of
segment
net
revenues 2013
% of
segment
net
revenues 2012
% of
segment
net
revenues 2014 vs. 2013 2013 vs. 2012
Net revenues 2,767 100.0% 1,659 100.0% 755 100.0% 1,108 66.8% 904 119.7%
EBIT 275 9.9% 106 6.4% 57 7.5% 169 159.4% 49 86.0%
Shipments 36 n.m. 15 n.m. 6 n.m. 21 140.0% 9 150.0%
Net revenues
2014 compared to 2013
Maserati net revenues were €2.8 billion, an increase of €1.1 billion, or 66.8 percent from €1.7 billion for the year
ended December 31, 2013, primarily driven by an increase in vehicle shipments from 15 thousand units for the year
ended December 31, 2013, to 36 thousand units for the year ended December 31, 2014.
2013 compared to 2012
Maserati net revenues for 2013 were €1.7 billion, an increase of €0.9 billion, from €0.8 billion for 2012. The increase
of €0.9 billion was largely attributable to the increase in vehicle shipments driven primarily by the 2013 launches of the
new Quattroporte model in March and the new Ghibli in October.
EBIT
2014 compared to 2013
Maserati EBIT for the year ended December 31, 2014 was €275 million, an increase of €169 million, or 159.4
percent, from €106 million for the year ended December 31, 2013. The increase was primarily driven by the growth
in shipments, as previously discussed. In 2013, EBIT included €65 million in unusual charges related to the write-
down of previously capitalized development costs following the decision to switch a future model to a more technically
advanced platform.
2013 compared to 2012
Maserati EBIT for 2013 was €106 million, an increase of €49 million, or 86.0 percent, from €57 million for 2012,
attributable to the combined effect of strong volume growth driven by the previously described 2013 product
launches, which was partially offset by an increase in other unusual expenses of €65 million related to the write-down
of capitalized development costs related to a new model, which will be developed on a more technically advanced
platform considered more appropriate for the Maserati brand.