Chrysler 2014 Annual Report Download - page 67
Download and view the complete annual report
Please find page 67 of the 2014 Chrysler annual report below. You can navigate through the pages in the report by either clicking on the pages listed below, or by using the keyword search tool below to find specific information within the annual report.-
 1
1 -
2
-
3
-
4
-
5
-
6
-
7
-
8
-
9
-
10
-
11
-
12
-
13
-
14
-
15
-
16
-
17
-
18
-
19
-
20
-
21
-
22
-
23
-
24
-
25
-
26
-
27
-
28
-
29
-
30
-
31
-
32
-
33
-
34
-
35
-
36
-
37
-
38
-
39
-
40
-
41
-
42
-
43
-
44
-
45
-
46
-
47
-
48
-
49
-
50
-
51
-
52
-
53
-
54
-
55
-
56
-
 57
57 -
 58
58 -
 59
59 -
 60
60 -
 61
61 -
 62
62 -
 63
63 -
 64
64 -
 65
65 -
 66
66 -
 67
67 -
 68
68 -
 69
69 -
 70
70 -
 71
71 -
 72
72 -
 73
73 -
 74
74 -
 75
75 -
 76
76 -
 77
77 -
78
-
79
-
80
-
81
-
82
-
83
-
84
-
85
-
86
-
87
-
88
-
89
-
90
-
91
-
92
-
93
-
94
-
95
-
96
-
97
-
98
-
99
-
100
-
101
-
102
-
103
-
104
-
105
-
106
-
107
-
108
-
109
-
110
-
111
-
112
-
113
-
114
-
115
-
116
-
117
-
118
-
119
-
120
-
121
-
122
-
123
-
124
-
125
-
126
-
127
-
128
-
129
-
130
-
131
-
132
-
133
-
134
-
135
-
136
-
137
-
138
-
139
-
140
-
141
-
142
-
143
-
144
-
145
-
146
-
147
-
148
-
149
-
150
-
151
-
152
-
153
-
154
-
155
-
156
-
157
-
158
-
159
-
160
-
161
-
162
-
163
-
164
-
165
-
166
-
167
-
168
-
169
-
170
-
171
-
172
-
173
-
174
-
175
-
176
-
177
-
178
-
179
-
180
-
181
-
182
-
183
-
184
-
185
-
186
-
187
-
188
-
189
-
190
-
191
-
192
-
193
-
194
-
195
-
196
-
197
-
198
-
199
-
200
-
201
-
202
-
203
-
204
-
205
-
206
-
207
-
208
-
209
-
210
-
211
-
212
-
213
-
214
-
215
-
216
-
217
-
218
-
219
-
220
-
221
-
222
-
223
-
224
-
225
-
226
-
227
-
228
-
229
-
230
-
231
-
232
-
233
-
234
-
235
-
236
-
237
-
238
-
239
-
240
-
241
-
242
-
243
-
244
-
245
-
246
-
247
-
248
-
249
-
250
-
251
-
252
-
253
-
254
-
255
-
256
-
257
-
258
-
259
-
260
-
261
-
262
-
263
-
264
-
265
-
266
-
267
-
268
-
269
-
270
-
271
-
272
-
273
-
274
-
275
-
276
-
277
-
278
-
279
-
280
-
281
-
282
-
283
-
284
-
285
-
286
-
287
-
288
-
289
-
290
-
291
-
292
-
293
-
294
-
295
-
296
-
297
-
298
-
299
-
300
-
301
-
302
-
303
 |
 |

2014 | ANNUAL REPORT 65
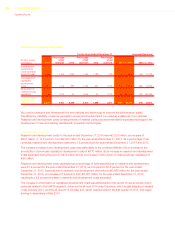
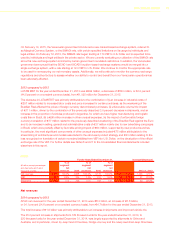
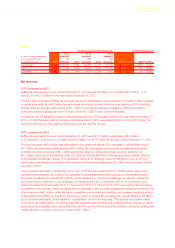
Net financial income/(expenses)
For the Years Ended December 31, Increase/(decrease)
(€ million, except percentages) 2014 2013 2012 2014 vs. 2013 2013 vs. 2012
Net financial income/(expenses) (2,047) (1,987) (1,910) (60) (3.0)% (77) (4.0)%
2014 compared to 2013
Net financial expenses for the year ended December 31, 2014 were €2,047, an increase of €60 million, or 3.0
percent, from €1,987 million for the year ended December 31, 2013.
Excluding the gain on the Fiat stock option-related equity swaps of €31 million recognized in the year ended
December 31, 2013, net financial expenses were substantially unchanged as the benefits from the new financing
transactions completed in February 2014 by FCA US were offset by higher average debt levels (refer to Note 27 to
the Consolidated financial statements included elsewhere in this report for a more detailed description of the new
financings of FCA US).
2013 compared to 2012
Net financial expenses for the year ended December 31, 2013 were €1,987 million, an increase of €77 million, or 4.0
percent, from €1,910 million for the year ended December 31, 2012. Excluding the gains on the Fiat stock option-
related equity swaps (€31 million for 2013, at their expiration, compared to €34 million for 2012), net financial expense
was €74 million higher, largely due to a higher average net debt level.
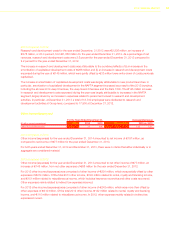
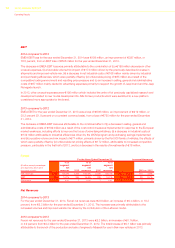
Tax expense/(income)
For the Years Ended December 31, Increase/(decrease)
(€ million, except percentages) 2014 2013 2012 2014 vs. 2013 2013 vs. 2012
Tax expense/(income) 544 (936) 628 1,480 158.1% (1,564) n.m
2014 compared to 2013
Tax expense for the year ended December 31, 2014 was €544 million, compared with tax income of €936 million
for the year ended December 31, 2013. At December 31, 2013, previously unrecognized deferred tax assets of
€1,500 million were recognized, principally related to tax loss carry forwards and temporary differences in the NAFTA
operations.
Higher deferred tax expense in 2014 due to utilization of a portion of the deferred tax assets recognized in 2013 were
largely offset by non-recurring deferred tax benefits which did not occur in the prior year.
In 2014, the Group’s effective tax rate is equal to 39.5%. The difference between the theoretical and the effective
income taxes is primarily due to €379 million arising from the unrecognized deferred tax assets on temporary
differences and tax losses originating in the year in EMEA, which is partially offset by the recognition of non-recurring
deferred tax benefits of €173 million.