Chrysler 2014 Annual Report Download - page 74
Download and view the complete annual report
Please find page 74 of the 2014 Chrysler annual report below. You can navigate through the pages in the report by either clicking on the pages listed below, or by using the keyword search tool below to find specific information within the annual report.-
 1
1 -
2
-
3
-
4
-
5
-
6
-
7
-
8
-
9
-
10
-
11
-
12
-
13
-
14
-
15
-
16
-
17
-
18
-
19
-
20
-
21
-
22
-
23
-
24
-
25
-
26
-
27
-
28
-
29
-
30
-
31
-
32
-
33
-
34
-
35
-
36
-
37
-
38
-
39
-
40
-
41
-
42
-
43
-
44
-
45
-
46
-
47
-
48
-
49
-
50
-
51
-
52
-
53
-
54
-
55
-
56
-
57
-
58
-
59
-
60
-
61
-
62
-
63
-
 64
64 -
 65
65 -
 66
66 -
 67
67 -
 68
68 -
 69
69 -
 70
70 -
 71
71 -
 72
72 -
 73
73 -
 74
74 -
 75
75 -
 76
76 -
 77
77 -
 78
78 -
 79
79 -
 80
80 -
 81
81 -
 82
82 -
 83
83 -
 84
84 -
85
-
86
-
87
-
88
-
89
-
90
-
91
-
92
-
93
-
94
-
95
-
96
-
97
-
98
-
99
-
100
-
101
-
102
-
103
-
104
-
105
-
106
-
107
-
108
-
109
-
110
-
111
-
112
-
113
-
114
-
115
-
116
-
117
-
118
-
119
-
120
-
121
-
122
-
123
-
124
-
125
-
126
-
127
-
128
-
129
-
130
-
131
-
132
-
133
-
134
-
135
-
136
-
137
-
138
-
139
-
140
-
141
-
142
-
143
-
144
-
145
-
146
-
147
-
148
-
149
-
150
-
151
-
152
-
153
-
154
-
155
-
156
-
157
-
158
-
159
-
160
-
161
-
162
-
163
-
164
-
165
-
166
-
167
-
168
-
169
-
170
-
171
-
172
-
173
-
174
-
175
-
176
-
177
-
178
-
179
-
180
-
181
-
182
-
183
-
184
-
185
-
186
-
187
-
188
-
189
-
190
-
191
-
192
-
193
-
194
-
195
-
196
-
197
-
198
-
199
-
200
-
201
-
202
-
203
-
204
-
205
-
206
-
207
-
208
-
209
-
210
-
211
-
212
-
213
-
214
-
215
-
216
-
217
-
218
-
219
-
220
-
221
-
222
-
223
-
224
-
225
-
226
-
227
-
228
-
229
-
230
-
231
-
232
-
233
-
234
-
235
-
236
-
237
-
238
-
239
-
240
-
241
-
242
-
243
-
244
-
245
-
246
-
247
-
248
-
249
-
250
-
251
-
252
-
253
-
254
-
255
-
256
-
257
-
258
-
259
-
260
-
261
-
262
-
263
-
264
-
265
-
266
-
267
-
268
-
269
-
270
-
271
-
272
-
273
-
274
-
275
-
276
-
277
-
278
-
279
-
280
-
281
-
282
-
283
-
284
-
285
-
286
-
287
-
288
-
289
-
290
-
291
-
292
-
293
-
294
-
295
-
296
-
297
-
298
-
299
-
300
-
301
-
302
-
303
 |
 |

72 2014 | ANNUAL REPORT
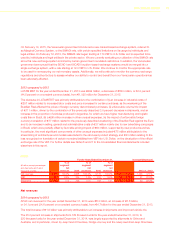
Operating Results
2013 compared to 2012
APAC net revenues for the year ended December 31, 2013 were €4.7 billion, an increase of €1.5 billion,
or 47.1 percent (54.2 percent on a constant currency basis), from €3.2 billion for the year ended December 31, 2012.
The total increase of €1.5 billion was mainly attributable to an increase in shipments of €1.8 billion, which was partially
offset by the impact of unfavorable foreign currency translation of €0.2 billion.
The 58.3 percent increase in vehicle shipments from 103 thousand units for the year ended December 31, 2012 to
163 thousand units for the year ended December 31, 2013 was primarily driven by our performance in China and
Australia. In particular, our performance in China was driven by efforts to grow our dealer network, the reintroduction
of the Dodge Journey and our continued strong performance of the Jeep brand, as a result of which our China
market share increased from 0.4 percent in 2012 to 0.8 percent in 2013, while our growth in Australia was mainly
driven by the Fiat and Alfa Romeo brands, resulting in an increase in market share from 2.1 percent for the year
ended December 31, 2012 to 3.1 percent for the year ended December 31, 2013. The increase in shipments also
resulted in an increase in service parts, accessories and service contracts and other revenues, supported our market
share growth in APAC markets. The impact of unfavorable foreign currency translation was primarily attributable to
fluctuations of the U.S. Dollar and to a lesser extent, the Japanese Yen against the Euro. In particular, the FCA US
portion of APAC segment net revenues were translated from FCA US’s functional currency which is the U.S. Dollar
into the Euro, and not from the individual entity functional currency into Euro.
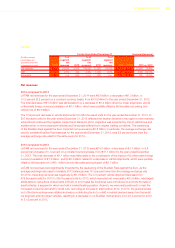
EBIT
2014 compared to 2013
APAC EBIT for the year ended December 31, 2014 was €537 million, an increase of €202 million, or 60.3 percent
(unchanged on a constant currency basis) from €335 million for the year ended December 31, 2013.
The increase in APAC EBIT was primarily attributable to (i) a positive volume/mix impact of €494 million as a result of
the increase in shipments described above partially offset by (ii) an increase in selling, general and administrative costs
of €111 million to support the growth of the APAC operations, (iii) an increase in industrial costs of €54 million due to
higher research and development costs, increased fixed manufacturing costs for new product initiatives and higher
production volumes, (iv) unfavorable pricing of €142 million due to the increasingly competitive trading environment,
particularly in China.
2013 compared to 2012
APAC EBIT for the year ended December 31, 2013 was €335 million, an increase of €61 million, or 22.3 percent
(27.7 percent on a constant currency basis) from €274 million for the year ended December 31, 2012.
The increase in APAC EBIT was attributable to the combined effect of (i) the positive volume and mix impact of
€423 million, driven by the efforts to grow our presence in the APAC markets and the previously described 2013
launches of new vehicles, which was partially offset by (ii) an increase in industrial costs of €106 million in higher
research and development costs and fixed manufacturing costs, attributable to the growth in our business,
(iii) unfavorable pricing effects of €79 million due to the increasingly competitive environment, particularly in China,
(iv) an increase in selling, general and administrative costs of €72 million driven by the advertising and promotional
expenses incurred in relation to the 2013 launches, including the Dodge Journey and Jeep Compass/Patriot in China
and the new Fiat Punto and Fiat Panda in Australia (v) a €26 million decrease in the results of investments, and (vi)
the impact of unfavorable foreign currency translation of €15 million. The decrease in result from investments was
largely due to the €23 million increase in the loss recorded in the Chinese joint venture GAC FIAT Automobiles Co,
attributable to the costs incurred in relation to the future launch of the Fiat Viaggio.