Chrysler 2014 Annual Report Download - page 191
Download and view the complete annual report
Please find page 191 of the 2014 Chrysler annual report below. You can navigate through the pages in the report by either clicking on the pages listed below, or by using the keyword search tool below to find specific information within the annual report.-
 1
1 -
2
-
3
-
4
-
5
-
6
-
7
-
8
-
9
-
10
-
11
-
12
-
13
-
14
-
15
-
16
-
17
-
18
-
19
-
20
-
21
-
22
-
23
-
24
-
25
-
26
-
27
-
28
-
29
-
30
-
31
-
32
-
33
-
34
-
35
-
36
-
37
-
38
-
39
-
40
-
41
-
42
-
43
-
44
-
45
-
46
-
47
-
48
-
49
-
50
-
51
-
52
-
53
-
54
-
55
-
56
-
57
-
58
-
59
-
60
-
61
-
62
-
63
-
64
-
65
-
66
-
67
-
68
-
69
-
70
-
71
-
72
-
73
-
74
-
75
-
76
-
77
-
78
-
79
-
80
-
81
-
82
-
83
-
84
-
85
-
86
-
87
-
88
-
89
-
90
-
91
-
92
-
93
-
94
-
95
-
96
-
97
-
98
-
99
-
100
-
101
-
102
-
103
-
104
-
105
-
106
-
107
-
108
-
109
-
110
-
111
-
112
-
113
-
114
-
115
-
116
-
117
-
118
-
119
-
120
-
121
-
122
-
123
-
124
-
125
-
126
-
127
-
128
-
129
-
130
-
131
-
132
-
133
-
134
-
135
-
136
-
137
-
138
-
139
-
140
-
141
-
142
-
143
-
144
-
145
-
146
-
147
-
148
-
149
-
150
-
151
-
152
-
153
-
154
-
155
-
156
-
157
-
158
-
159
-
160
-
161
-
162
-
163
-
164
-
165
-
166
-
167
-
168
-
169
-
170
-
171
-
172
-
173
-
174
-
175
-
176
-
177
-
178
-
179
-
180
-
 181
181 -
 182
182 -
 183
183 -
 184
184 -
 185
185 -
 186
186 -
 187
187 -
 188
188 -
 189
189 -
 190
190 -
 191
191 -
 192
192 -
 193
193 -
 194
194 -
 195
195 -
 196
196 -
 197
197 -
 198
198 -
 199
199 -
 200
200 -
 201
201 -
202
-
203
-
204
-
205
-
206
-
207
-
208
-
209
-
210
-
211
-
212
-
213
-
214
-
215
-
216
-
217
-
218
-
219
-
220
-
221
-
222
-
223
-
224
-
225
-
226
-
227
-
228
-
229
-
230
-
231
-
232
-
233
-
234
-
235
-
236
-
237
-
238
-
239
-
240
-
241
-
242
-
243
-
244
-
245
-
246
-
247
-
248
-
249
-
250
-
251
-
252
-
253
-
254
-
255
-
256
-
257
-
258
-
259
-
260
-
261
-
262
-
263
-
264
-
265
-
266
-
267
-
268
-
269
-
270
-
271
-
272
-
273
-
274
-
275
-
276
-
277
-
278
-
279
-
280
-
281
-
282
-
283
-
284
-
285
-
286
-
287
-
288
-
289
-
290
-
291
-
292
-
293
-
294
-
295
-
296
-
297
-
298
-
299
-
300
-
301
-
302
-
303
 |
 |

2014 | ANNUAL REPORT 189
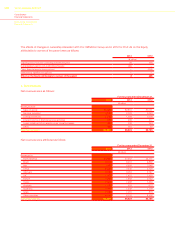
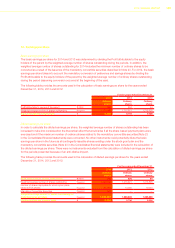
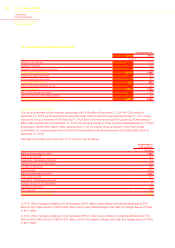
12. Earnings per share
Basic earnings per share
The basic earnings per share for 2014 and 2013 was determined by dividing the Profit attributable to the equity
holders of the parent by the weighted average number of shares outstanding during the periods. In addition, the
weighted average number of shares outstanding for 2014 includes the minimum number of ordinary shares to be
converted as a result of the issuance of the mandatory convertible securities described in Note 23. For 2012, the basic
earnings per share takes into account the mandatory conversion of preference and savings shares by dividing the
Profit attributable to the equity holders of the parent by the weighted average number of ordinary shares outstanding
during the period (assuming conversion occurred at the beginning of the year).
The following table provides the amounts used in the calculation of basic earnings per share for the years ended
December 31, 2014, 2013 and 2012:
For the years ended December 31,
2014 2013 2012
Ordinary
shares
Ordinary
shares
Ordinary
shares
Profit attributable to owners of the parent € million 568 904 44
Weighted average number of shares outstanding thousand 1,222,346 1,215,921 1,215,828
Basic earnings per ordinary share €0.465 0.744 0.036
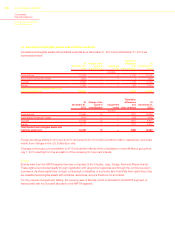
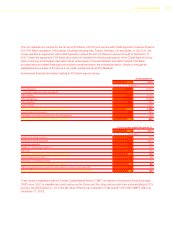
Diluted earnings per share
In order to calculate the diluted earnings per share, the weighted average number of shares outstanding has been
increased to take into consideration the theoretical effect that would arise if all the share-based payment plans were
exercised and if the maximum number of ordinary shares related to the mandatory convertible securities (Note 23
in the Consolidated financial statements) were converted. No other instruments could potentially dilute the basic
earnings per share in the future as all contingently issuable shares existing under the stock grant plan and the
mandatory convertible securities (Note 23 in the Consolidated financial statements) were included in the calculation of
the diluted earnings per share. There were no instruments excluded from the calculation of diluted earnings per share
for the periods presented because of an anti-dilutive impact.
The following table provides the amounts used in the calculation of diluted earnings per share for the years ended
December 31, 2014, 2013 and 2012:
For the years ended December 31,
2014 2013 2012
Ordinary
shares
Ordinary
shares
Ordinary
shares
Profit attributable to owners of the parent € million 568 904 44
Weighted average number of shares outstanding thousand 1,222,346 1,215,921 1,215,828
Number of shares deployable for stock option plans
linked to FCA shares thousand 11,204 13,005 10,040
Mandatory Convertible Securities thousand 547 — —
Weighted average number of shares outstanding for
diluted earnings per share thousand 1,234,097 1,228,926 1,225,868
Diluted earnings per ordinary share €0.460 0.736 0.036